This is the Part 2 of a series. Feel free to read the prequel for more context: Building the fastest Lua interpreter automatically
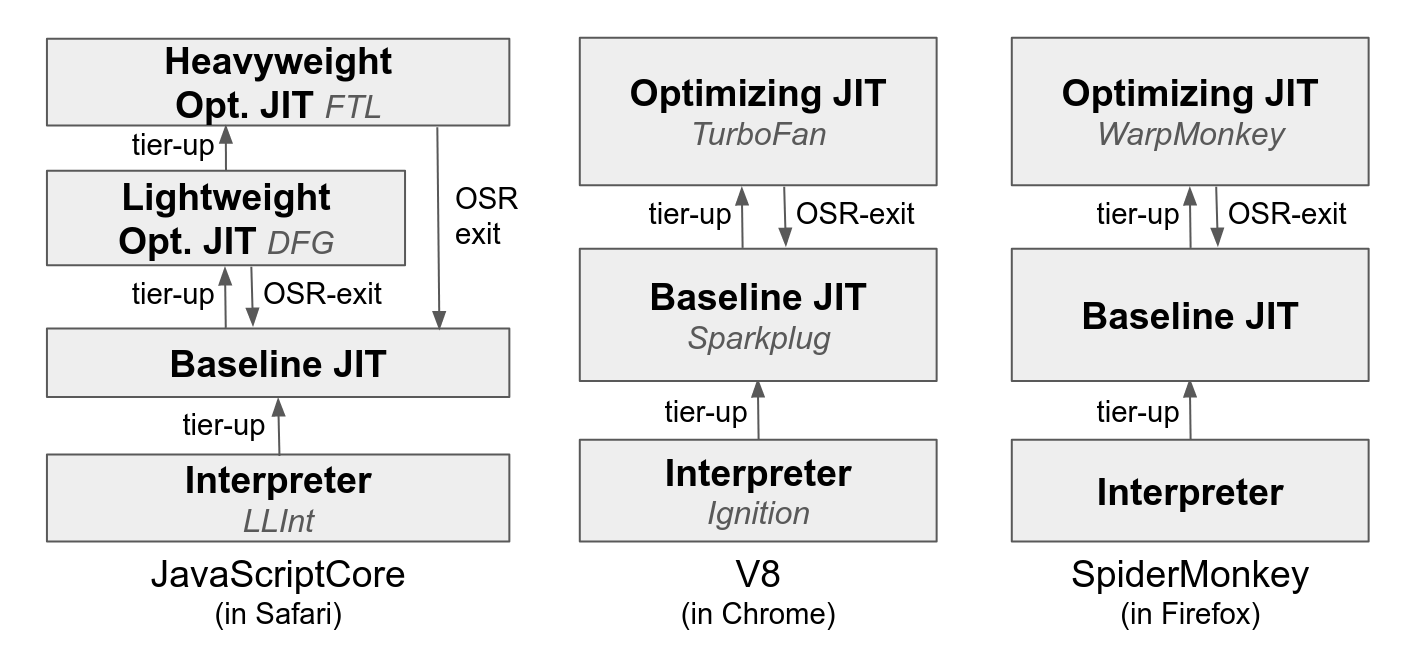
Building a good VM for a dynamic language takes a ton of engineering. The best-performing VMs (e.g., JavaScriptCore, V8, SpiderMonkey) employ at least 3 VM tiers (interpreter, baseline JIT[1] and optimizing JIT), and pervasively use hand-coded assembly in every VM tier[2]. Optimizations such as inline caching and type speculation are required to get high performance, but they require high expertise and introduce additional engineering complexity.
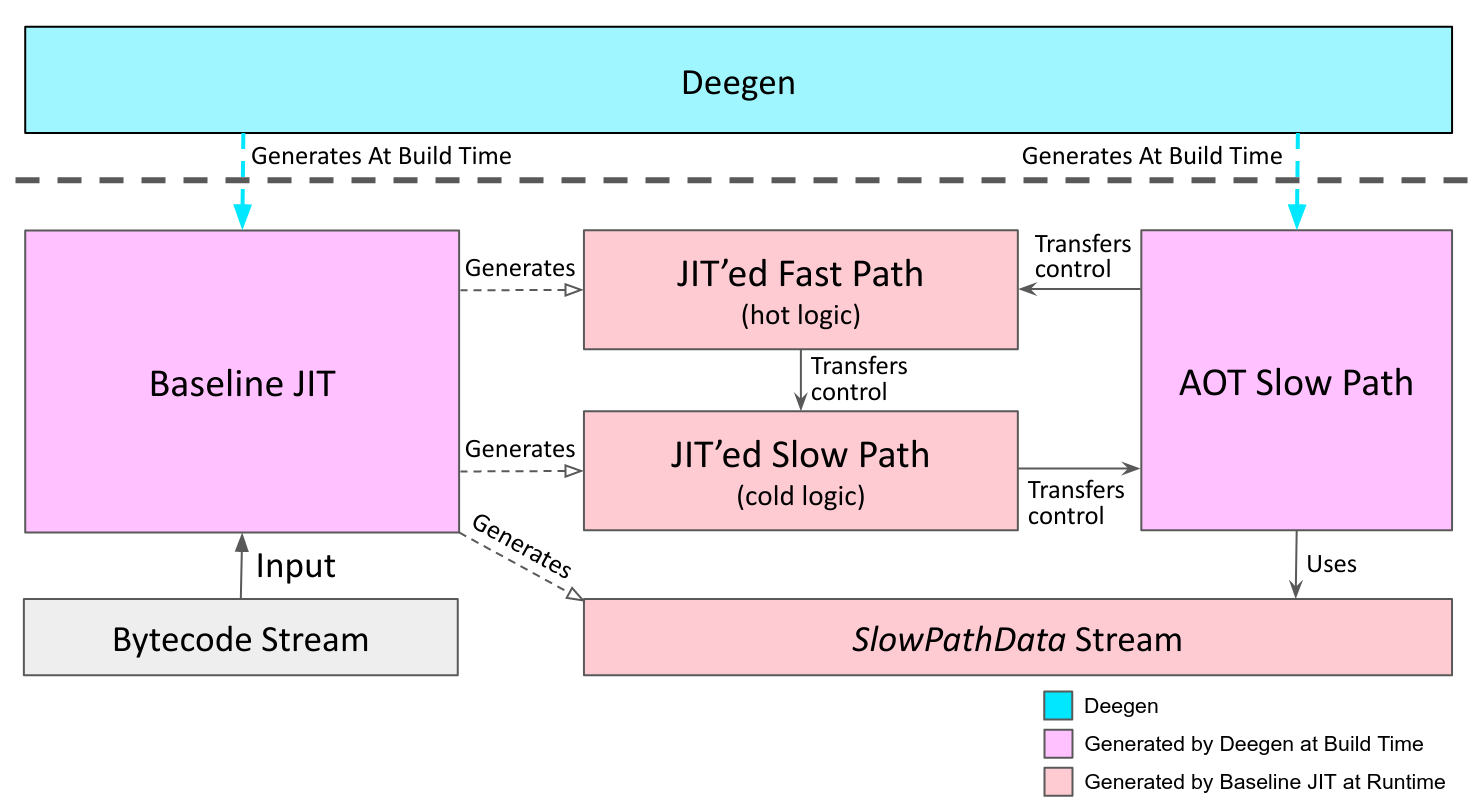
Deegen is my research meta-compiler to make high-performance VMs easier to write. Deegen takes in a semantic description of the VM bytecodes in C++, and use it as the single source of truth to automatically generate a high-performance VM at build time, as illustrated below.
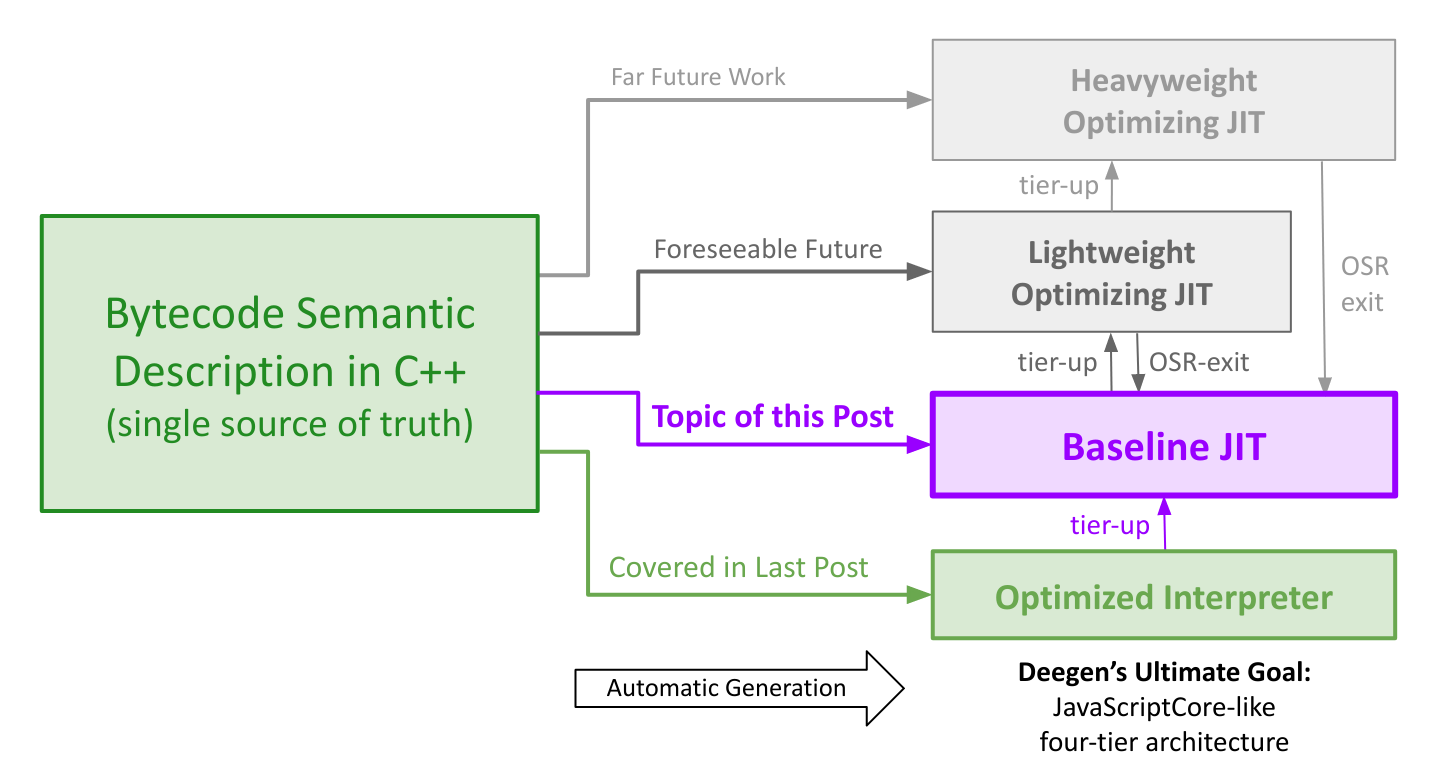
In a prior post, we used Deegen to automatically generate the fastest Lua 5.1 interpreter to date, outperforming LuaJIT’s interpreter by an average of 34% across a variety of Lua benchmarks. The VM was named LuaJIT Remake, even though it had no JIT tiers at that time.
Today, after months of additional work, LuaJIT Remake is finally a JIT-capable VM. It is now equipped with a state-of-the-art baseline JIT compiler, also automatically generated by Deegen. The baseline JIT features:
- Extremely fast compilation speed.
- High-quality machine code (under the design constraints of a baseline JIT).
- Automatic call inline caching (IC) with two modes (direct/closure call).
- Automatic generic inline caching (IC) driven by Deegen API.
- Self-modifying-code-based IC implementation for best performance.
- Hot-cold-splitted JIT code for less branches and better code locality.
It is important to note that the baseline JIT is generated from the same bytecode semantic description that Deegen uses to generate the interpreter. Therefore, for a language implementer, the baseline JIT comes for free:
- No need to have any assembly knowledge.
- No need to manually engineer the JIT.
- No need to manually keep the JIT updated with new language features.
Because Deegen does all the work automatically!
Of course, this is no easy feat. In order to generate the baseline JIT automatically, a sophiscated build-time pipeline is employed, as illustrated below.
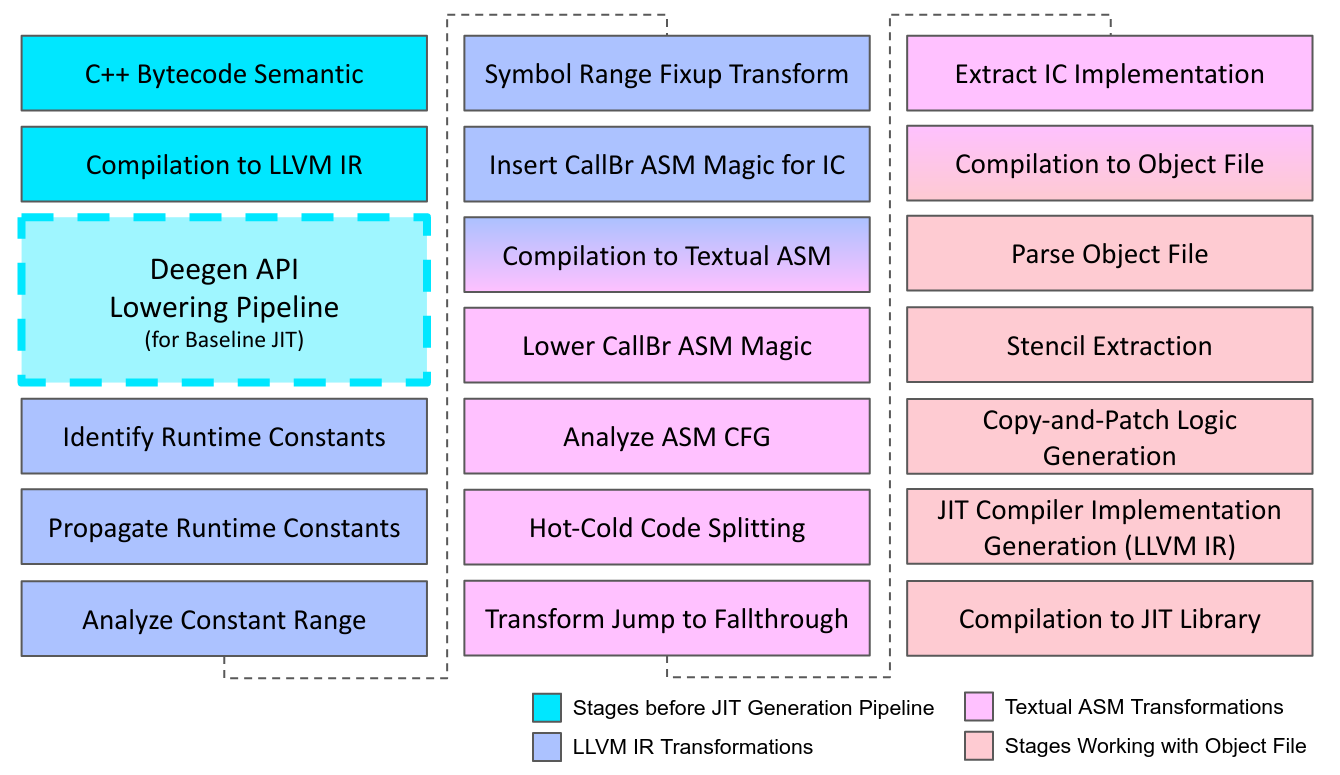
As a side note, LLVM is only used at build time to generate the JIT. The generated baseline JIT is self-contained, and does not use LLVM at runtime.
At runtime, the generated baseline JIT generates machine code using Copy-and-Patch (we’ll cover it in a minute). Except that, it heavily follows the design of the baseline JIT in JavaScriptCore, and has employed most of their optimizations. As such, we claim that our baseline JIT qualifies as a state-of-the-art.
In the rest of the post, we will explore the internals of how Deegen generates the baseline JIT in more detail. It is organized as follows:
- A gentle introduction of the relavent backgrounds (VM, JIT, IC, etc.).
- An overview of the Copy-and-Patch technique, the core tool employed by the generated JIT to generate machine code at runtime.
- How Deegen further extends Copy-and-Patch to fully automate the process and fit it for the domain-specific use cases of dynamic languages.
- An end-to-end example of the machine code generated by the baseline JIT.
- Performance evaluation and conclusion thoughts.
Background
Not everyone is familiar with topics like modern dynamic language VM, multi-tier JIT compilers, baseline JIT, speculative compilation, inline caching, OSR exit… Therefore, I prepared a background section to gently introduce the background contexts for this post.
Due to its length, I folded this section by default. To unfold, click here.
How to Generate Machine Code?
For every JIT, this is an unavoidable problem: how do you generate machine code?
A typical solution used by many (JSC, V8, LuaJIT, etc) is a hand-coded assembler. The assembler provides APIs (e.g., EmitMovRegReg64) to the JIT, which the JIT uses to emit assembly instructions as machine code one by one.
However, such an approach is clearly infeasible for a meta-compiler like Deegen, as our input is expressed as C++ bytecode semantics.
So can we use LLVM directly at runtime to generate code? Unfortunately this is also impractical, as LLVM’s compilation speed is too slow even for a heavyweight optimizing JIT, not to mention a baseline JIT where fast compilation is a top concern.
Copy-and-Patch: the Art of Repurposing Existing Tools
The solution is a paper I wrote years ago: Copy-and-Patch Compilation.
In one sentence, Copy-and-Patch is a trick that allows one to generate code without knowing anything about how to generate code.
How is that even possible? While the paper is long, the trick is actually extremely simple, which I will explain here.
Consider the following C++ function:
1 | int evaluate_lhs(); |
When the C++ compiler compiles the above code, it knows nothing about the definition of evaluate_lhs and evaluate_rhs. But it can somehow produce an object file, and the linker can link the object file to any definition of evaluate_lhs and evaluate_rhs, and the final executable would just work.
Relocation = Code Generation
What does it mean? The object file must contain structured information on how to link evaluate_add against any definition of evaluate_lhs and evaluate_rhs. So if we parse the object file to get that info, at runtime, we can act as the linker, and “link” evaluate_add against any runtime-known evaluate_lhs and evaluate_rhs of our choice to perform an add. This is effectively a JIT[8]!
Of course, the “structured information” has its formal name: linker relocation records. But the name is not important. The important thing is as long as we parsed out those information, we can use them at runtime to emit executable code. And this process is extremely cheap: all it takes is a memcpy followed by a few scalar additions, thus the name “Copy-and-Patch”.
For example, the evaluate_add we just saw will produce an object file with the following contents:
1 | evaluate_add: |
with the following linker relocation record:
1 | offset = 2, type = R_X86_64_PLT32, sym = evaluate_lhs, addend = -4 |
Then, the following copy-and-patch logic would allow one to JIT this function at any address with any desired evaluate_lhs and evaluate_rhs targets:
1 | void codegen(uint8_t* dst, uint8_t* lhsFn, uint8_t* rhsFn) { |
Yes, that’s all of the core trick of Copy-and-Patch: at build time, compile the logic pieces we want to JIT into object file, and parse the object file to obtain the unrelocated code and relocation records (a stencil in the paper’s terminology). At runtime, code generation is simply wiring up the stencils and materializing them into executable code by a copy (memcpy) and a few patches (scalar additions).
Continuation-Passing Style = Branch
The generated code above works, but the code quality is miserable. Everything is executed by a call to another function, which is a lot of overhead.
However, what if one rewrites the code to continuation-passing style?
1 | void continuation(int result); |
Now, the calls are gone. Furthermore, the function will end with a jmp instruction to function continuation (since the call is a tail call). Since we have control over where to put each function at, if we put continuation right after evaluate_add, then we can even eliminate the jmp to a fallthrough altogether[9].
After employing this trick, it’s fairly easy to prove that the generated code will not contain unnecessary jmp instructions: all the branches must correspond to actual control flow edges in the generated logic.
One of the main reasons that interpreters are slow is the unpredictable indirect dispatch. At this stage, our generated code has no indirect dispatch, in fact, no unnecessary branches at all. This is already a big speedup over an interpreter.
Address of External Symbol = Runtime Constant
Another important reason that JITs are faster than interpreters is the ability of JIT to burn runtime constants (bytecode operands, etc) into the instruction stream. Can we support it as well?
Of course! The trick is simple:
1 | extern char x; // define an external variable |
All it takes is to define an external symbol, and use its address as the runtime constant we want to use. Since by definition an external symbol is external, the compiler cannot assume anything about where it resides at[10]. This gives us a way to represent an opaque constant value.
Of course, the linker knows how to patch the code to make the external symbol point to the right location. Thus, we can patch it at runtime to make it represent any runtime constant as well :)
Function Prototype = Register Allocation / Combinatorial Explosion = Instruction Selection
Finally, there are two most important codegen-level optimizations: register allocation and instruction selection[11]. Can we support them as well? The answer is yes. However, these optimizations are primarily only useful for the static language use cases where each bytecode only implements very simple logic[12]. So to keep this post focused, I will not go into details.
Copy-and-Patch: Wrapping up
I wouldn’t mind at all if you view Copy-and-Patch as a big hack: because it is! But it works! And it works nicely!
As shown in the paper, one can use Copy-and-Patch to construct extremely fast baseline JIT that significantly outperforms the existing state-of-the-arts:
- For WebAssembly, we implemented a baseline JIT that compiles 4.9x-6.5x faster than Google Chrome’s Liftoff baseline compiler, while also generating 39%-63% faster code.
- For SQL database, we implemented a prototype SQL query baseline JIT that on TPC-H queries, compiles >1000x faster than LLVM -O3, while only generating 24% slower code.
Furthermore, Copy-and-Patch perfectly suits Deegen’s needs for a JIT:
- It does not know or care about what is being JIT’ed. The logic we want to JIT is directly compiled by a C++ compiler into an object file at build time. C&P merely parses the object file to produce the stencils, which can then be used to JIT code at runtime.
- The code generation at runtime is extremely fast, which perfectly matches the requirement of a baseline JIT. Note that we are doing a lot of expensive preprocessing work, but all of them happen at build time.
Deegen: the Art of Repurposing Existing Tools, Continued
While Copy-and-Patch is a nice technique, its vanilla form as described above is still not enough to fulfill Deegen’s use case. Specifically, the vanilla Copy-and-Patch still requires quite a bit of manual work to implement the stencils and the runtime logic, whereas in Deegen, all must be fully automatic.
As it turns out, fully automating Copy-and-Patch requires significant design-level improvements to the original technique, which we will cover in this section.
To make things easier to understand, we will use the following hypothetical Add bytecode as example (see prior post for a detailed explanation of the code):
1 | void Add(TValue lhs, TValue rhs) { |
Identifying the Runtime Constants
To get good performance, it is almost mandetory for a JIT to be able to burn runtime constants (bytecode operands, etc.) into the instruction flow. In vanilla Copy-and-Patch, the programmer is required to declare the runtime constants by special macros. So our first improvement is to make this step automatic.
Fortunately this is fairly easy. In our case, the runtime constants are the bytecode operands, and for the IC, everything in the IC state. Since Deegen is already responsible for generating the bytecode decoding logic and the encoding / decoding of the IC state, all we need to do is to not emit the decoding logic, but a magic function call, so that the later processing stages knows that the value is a runtime constant.
For example, for Add, we know that the bytecode slot ordinal of lhs, rhs and the output slot are runtime constants. So the bytecode semantic function will be lowered to LLVM IR that conceptually resembles the following C logic:
1 | size_t lhs_slot = __runtime_constant_lhs_slot(); |
Correspondingly, at runtime, in order for the generated JIT to generate code, it needs to decode the bytecode struct to retrieve all the operand values and use these values to materialize the copy-and-patch stencils: we will showcase the concrete generated implementation of the __codegen_Add function (which emits machine code for Add at runtime) later in the post.
Propagating the Runtime Constants
Acute readers may have noticed that the C logic above cannot result in optimal code. Consider line 3: TValue lhs = stack[lhs_slot]. What actually happens in this line is that we are decoding address (uint64_t)stack + lhs_slot * 8 (since each TValue is 8 bytes). If we only make lhs_slot a runtime constant (as we are doing right now), there is no way for LLVM to fold lhs_slot * 8 into a constant (recall that at LLVM level, a runtime constant is really the address of an external symbol). As a result, it will generate less-optimal code like mov $XXXX, %rax; shl 3, %rax.
Therefore, we need a customized LLVM constant propagation pass to identify all the constant expressions derived from the “root” runtime constants. Then, we should make each constant expression a runtime constant. Of course, this also means that at runtime, in order to populate these derived runtime constants with concrete values, the codegen function needs to replay the computation of the expression using the concrete values of the root runtime constants.
After this transform, the LLVM IR of our Add example would resemble the following C logic:
1 | size_t tmp1 = __derived_runtime_constant_1(); |
where the derived runtime constants __derived_runtime_constant_1/2/3 are defined as follow:
1 | __derived_runtime_constant_1 := lhs_slot * 8 |
Fixing the Symbol Range Assumption
As we already explained, in Copy-and-Patch, a runtime constant is expressed by the address of an external symbol.
While it is a neat trick that is crucial for high-quality code, it could break down and cause miscompilation in edge cases. For example, consider the code below:
1 | extern char x; |
LLVM would deduce that the val == 0 check is trivially false, and “optimize away” the whole if-clause. Why? Because val is the address of variable x, and of course the address of a variable is never 0, good game.
In vanilla Copy-and-Patch, the programmer is responsible for avoiding such corner cases. But in Deegen, where stencils are automatically generated, we must find a systematic and provably-correct solution.
So what’s the issue? You might think the issue is “symbol must not be null”. That’s what I initially believed as well[13], but I later realized it is only the symptom of a much larger issue.
As it turns out, according to x86-64 ABI, every symbol will reside in address range [1, 2^31 - 2^24)[14]. This is also exactly the assumption held by LLVM, and used by LLVM to do optimizations (e.g., in the example above, it deduces that the address of a symbol must not equal 0). So the “val == 0 check” example is not the only buggy case. LLVM can, for example, do a zero extension instead of a sign extension, as it believes that the address of the symbol must have bit 31 being 0 thus a ZExt is equivalent to a SExt, causing buggy code if the runtime constant were to represent a negative value.
One might think the [1, 2^31 - 2^24) range assumption is artificial, but it isn’t. This range assumption is actually important to generate correct code. For a simple example, the code movq sym+100(%rax), %rax would not work correctly due to an int32_t overflow in the imm32 addressing mode field of the instruction, if sym were to have value 2^31 - 50.
Therefore, for a provably correct solution, we must make sure that whenever we use an external symbol to represent a runtime constant, the runtime constant we want to express must fit in [1, 2^31 - 2^24).
In Deegen, this is accomplished by a customized Constant Range Analysis pass to track the range of every constant expression based on the runtime constants. Of course, we also need to know the possible range for the “root” runtime constants – the bytecode operands, and the values captured by the IC state. Fortunately, for most of them, the range is implicit (for example, a bytecode slot is known to be a small non-negative integer, and an operand with type uint16_t obviously fits in [0, 65535]) and requires no user intervention. For the rest, a new Deegen API is added so the user can tell us the range assumption of the value.
Once we figured out the proven range of each runtime constant expression, we can retrofit it into our target range [1, 2^31 - 2^24) by simple transformation. To explain how it works, let’s revisit our Add example:
lhs_slotis a root runtime constant. Since it represents a bytecode slot ordinal, it is known to be a small non-negative integer, say[0, 10000].- And we have a derived runtime constant
lhs_slot * 8, which is known to fit in[0, 80000]by range analysis. - The range
[0, 80000]does not fit in[1, 2^31 - 2^24). - However, if we define a new expression
new_expr := lhs_slot * 8 + 1, the new expression would have range[1, 80001]and fit the assumption. - Therefore, we use an external symbol
symto representlhs_slot * 8 + 1, and rewrite the LLVM IR to substitutelhs * 8withsym - 1.
Now, we are guaranteed correct code as the symbol range assumption is met.
Lastly, if the range of an expression is too large to fit in [1, 2^31 - 2^24), we simply give up. This means the expression will be evaluated at runtime, but this is rare, and is only a minor performance issue, not a correctness issue.
After this transformation, the conceptual logic of the Add example would look like something below:
1 | size_t tmp1 = __derived_runtime_constant_1() - 1; |
where the derived runtime constants __derived_runtime_constant_1/2/3 are defined as follow:
1 | __derived_runtime_constant_1 := lhs_slot * 8 + 1 |
Note that in normal cases, those +1 / -1 adjustments will not end up as machine instructions in the resulting JIT code, as normally all of those computation ends up being an imm32 field of an instruction, as we’ll see in the example below.
Example: Generated Code for the AddVV Bytecode
For a concrete example, the figure below demonstrates the disassembly of the actual JIT code generated for the Lua AddVV bytecode, which performs a Lua add on the given two bytecode values. The C++ bytecode semantic that Deegen takes as input is here.
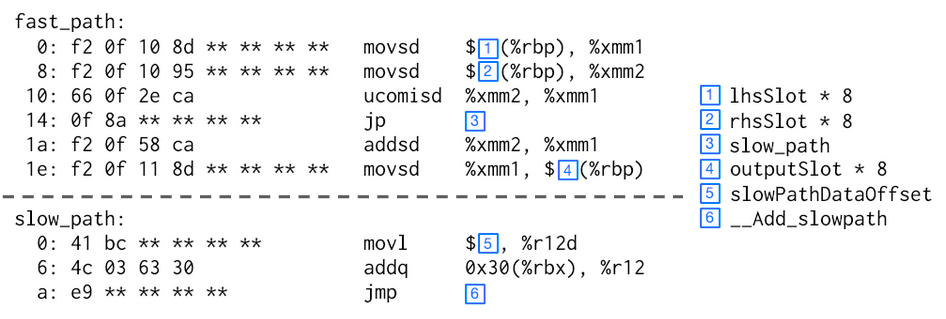
The blue boxes indicates the runtime constants that gets burnt into the instruction stream, with their value definitions shown on the right.
Note that the code contains two separated parts: fast_path and slow_path. We will explain this in detail in the next section: for now focus on fast_path only.
As one can see, the code quality has no problem rivalling a hand-written baseline JIT. It loads the two operands from the stack frame, and checks if any of them is NaN, which means either double NaN or a non-double value (which will exhibit as NaN in our NaN-boxing scheme). If so, it branches to slow_path. Otherwise, it performs a double addition and stores the result back to the output_slot in the stack frame. Finally, the control implicitly fallthroughs to the next bytecode.
The implementation of the JIT compiler logic that generates the above code at runtime will be showcased in the next section.
Design of the Baseline JIT
Having covered the core of the JIT code generation system, we are finally ready to explore the design of the JIT itself and the supporting components.
For a quick overview, the following figure illustrates the high-level architecture of the baseline JIT (except inline caching, which is complex enough that deserves its own section):
The AOT Slow Path
A distinctive “feature” of dynamic languages is the pervasive existence of slow paths. For example, if you call a boolean value like true (why would anyone do that?), it could trigger some complicated metamethod lookup in Lua, ending up with a function to call or an error. In Deegen, a slow path can be created by both automatic type-based quickening and explicit user annotation (the EnterSlowPath API). But for the JIT, there are some extra complexity in implementing them.
Obviously, the slow path logic should be AOT-compiled, not JIT’ed. However, this introduces two problems:
- How the JIT’ed code could transfer control to the AOT slow path.
- How the AOT slow path could transfer control back to the JIT’ed code.
Let’s look at the second problem first. The bytecode stream does not contain any information about the JIT’ed code. Also, the slow path could make branches to other bytecodes and calls to other functions, so it’s not as easy as letting the JIT’ed code pass the JIT address of the next bytecode to the slow path.
Deegen’s solution is a dedicated SlowPathData stream. The SlowPathData stream is similar to the bytecode stream, except that it is intended to be used by the AOT slow path of the JIT tier, instead of the interpreter. A SlowPathData contains all the information needed by the slow path, such as bytecode operands, JIT address for this bytecode, JIT address of the conditional branch target of this bytecode, etc. When the JIT’ed code wants to transfer control to the slow path, it would pass the SlowPathData pointer corresponding to the current bytecode to the AOT slow path. The AOT slow path can then have access to all the data it needs to complete the execution and transfer control back to JIT’ed code.
Of course, the SlowPathData stream has to be generated. Fortunately, since Deegen understands the bytecode stream, it is not hard to generate logic that transcribes the bytecode stream to the SlowPathData stream. Specifically, the generated JIT compiler will generate the SlowPathData stream alongside the executable code.
Now let’s look at the first problem. Transferring control from JIT’ed code to the AOT slow path requires some set up logic, for example, to correctly set up the SlowPathData pointer. However, these logic are rarely executed, as slow paths are, of course, rarely used. If no special handling is taken, the resulted code would have cold logic and hot logic mixed together, resulting in unnecessary additional branches and worse code locality. Of course, this is not a correctness problem, but ideally we want to handle it without sacrificing compilation time.
Deegen employs the solution used in JavaScriptCore: hot-cold code splitting, except that Deegen must accomplish it automatically. Specifically, every stencil will be split into a hot part and a cold part. The JIT will generate two streams of executable code, one holding all the hot path logic, and one holding all the slow path logic. The hot-cold splitting is accomplished by an ASM transformation pass, which we will elaborate in the next section.
The Baseline JIT Algorithm
We now have all the pretexts to understand how the baseline JIT itself works.
In addition to the logic that actually generates machine code, Deegen also generates a bytecode trait table that contains various info about the generated code for each bytecode, e.g., the length of the JIT’ed code’s hot part and cold part, the length and alignment of the data section accompanying the JIT’ed code, the length of the SlowPathData for this bytecode, etc. This allows the baseline JIT to precompute all the buffer sizes in advance.
The baseline JIT compiler works in two passes.
In the first pass, we iterates through the bytecode stream, and use the bytecode trait table to compute various buffer sizes of the generated code and data. All the buffers are then allocated in advance, knowing that a buffer overrun will never happen when we actually fill contents (code, data, etc.) into the buffers. This pass is very cheap because no indirect dispatch is needed.
In the second pass, we iterates through the bytecode stream again, and generate everything (executable code, the accompanying data, the SlowPathData, etc.) for each bytecode by populating the pre-allocated buffers. This step conceptually works similar to an interpreter. We have a pre-built dispatch table storing the codegen functions for each bytecode kind. Control is first transferred to the codegen function for the first bytecode. The function would generate everything needed for the first bytecode, advance buffer pointers accordingly, and then transfer control to the codegen function for the next bytecode. This process repeats until the end of the bytecode stream is reached.
Thanks to Copy-and-Patch, each codegen function is completely branchless, except the tail dispatch that transfers control to the next codegen function, as we shall see in the Add example below. This allows a modern CPU to utilize its Instruction-Level Paralleism (ILP) capabilities to the utmost, yielding an extremely fast compilation process.
Finally, due to the nature of one-pass code generation, bytecodes that can branch to other bytecodes would not know their branch destination address at the time their own code is being generated. To solve this issue, those bytecodes would push information about how the branch destination address shall be fixed up into a late-patch buffer. After all code generation is done, we need to iterate through the late-patch buffer and fix up all the branch targets.
Example: Code Generation Function for the AddVV Bytecode
Below is the actual code-generation logic generated by Deegen that generates code for the Lua AddVV bytecode. The machine code generated by the logic is demonstrated in the right half of the figure for cross-reference.
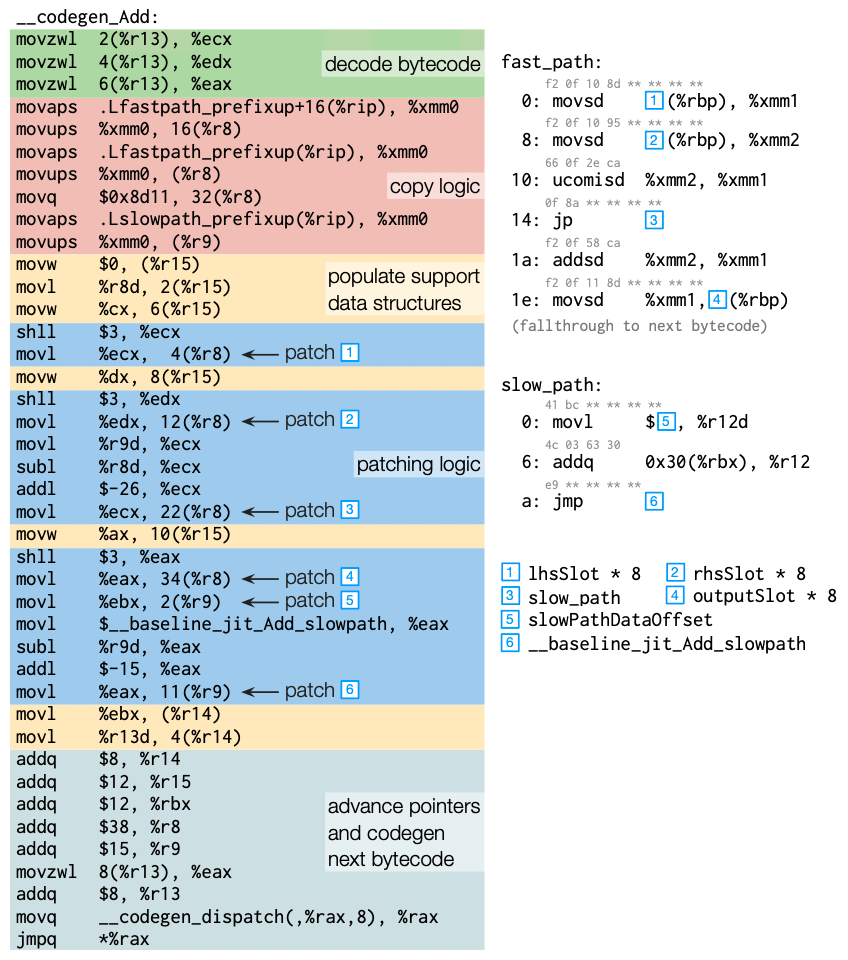
As one can see, the code-generation logic is just what we have explained in the previous subsection. It first decodes the bytecode, then performs a copy-and-patch to generate the JIT fast path and the JIT slow path logic. The expression that defines each runtime constant is replayed to compute the patch value in the instruction stream. Besides the machine code, it also generates the SlowPathData stream and other minor support data. Finally, it advances pointers and dispatch to the next codegen function to codegen the next bytecode. The whole process is completely branchless (except the tail dispatch) by design.
Supporting Inline Caching: the Art of Repurposing Existing Tools, Evermore
Due to inherent design constraints of a baseline JIT (e.g., compilation must be fast, no OSR-exit is allowed), inline caching (IC) is the only high-level optimization tool available to the baseline JIT.
And inline caching is powerful: on benchmarks that extensively work with Lua tables, a baseline JIT with IC can often be more than 100% faster than the same baseline JIT without IC[15].
In this section, we will elaborate how Deegen supports inline caching.
How IC works in Deegen: a Step-by-Step Example of Call IC
For a beginner’s introduction to what IC is, please read the background section. However, to understand how IC actually works in Deegen’s baseline JIT, the easiest way is to walk through an assembly example. Here, we will use a simplified Call bytecode, which performs a call with no arguments and discards all return values, to demonstrate how call IC works.
The C++ bytecode semantic description is very simple:
1 | void ReturnContinuation(TValue* /*base*/) { Return(); } |
It checks if the callee is a function object. If so, it uses Deegen’s MakeInPlaceCall API to make a call, and the return continuation simply discards all return values and transfer control to the next bytecode. Otherwise, it enters the outlined slow path function (omitted) that checks for a metatable call.
Deegen would generate the following JIT code for this bytecode:
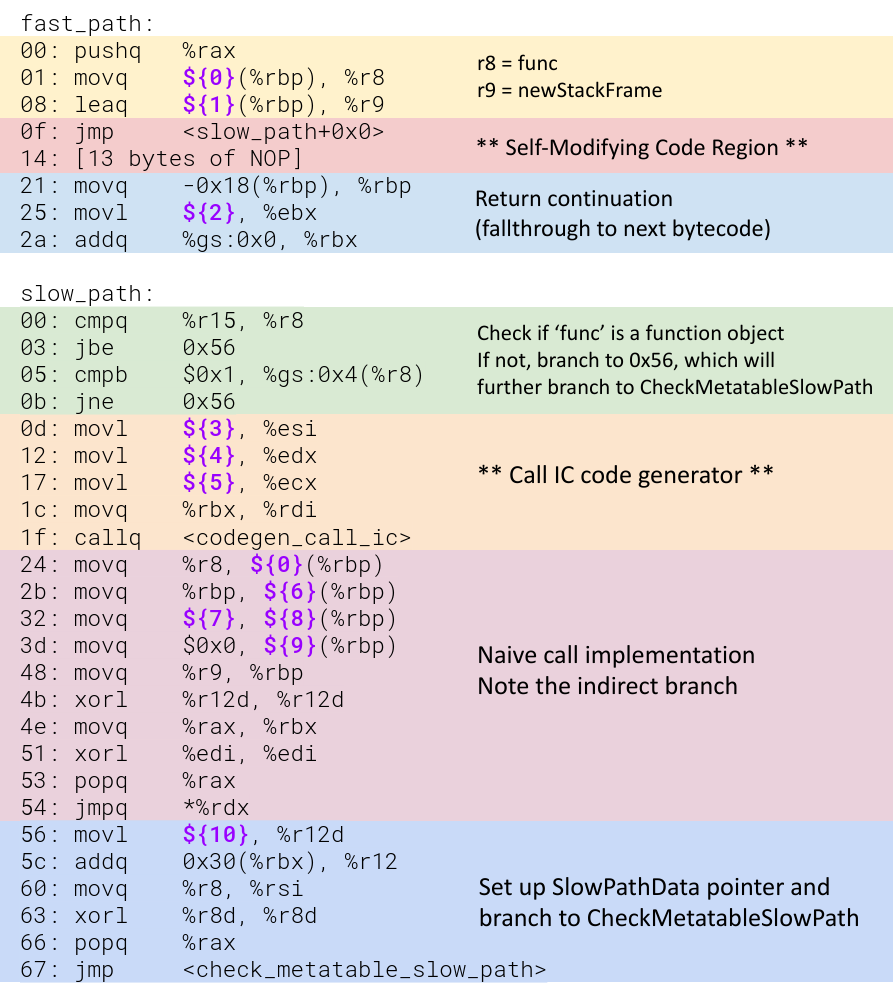
Note that runtime constants are marked in purple in the form of ${X}.
Let’s pretend for now that the codegen_call_ic thing doesn’t exist, and look at the naive implementation. If you stare at the assembly code a little bit, you will notice that the logic involves:
- Two branches to check that
funcis a function object. - Two dependent memory loads: one loads the function prototype
protofromfunc, and one loads the actual entry point address fromproto. - One indirect branch to branch to the entry point.
Unfortunately, dependent memory loads and unpredictable indirect branchs are exactly the two things modern CPUs hate the most. Even predictable branches can be slow, if there are too many of them so that the BTB is overwhelmed.
So how does IC speeds up this code?
As one might have expected, codegen_call_ic will be called on the first time this code is executed. What codegen_call_ic does is that it will emit a piece of IC code snippet, and chain it to the main logic by repatching the self-modifying-code (SMC) region, as shown below:
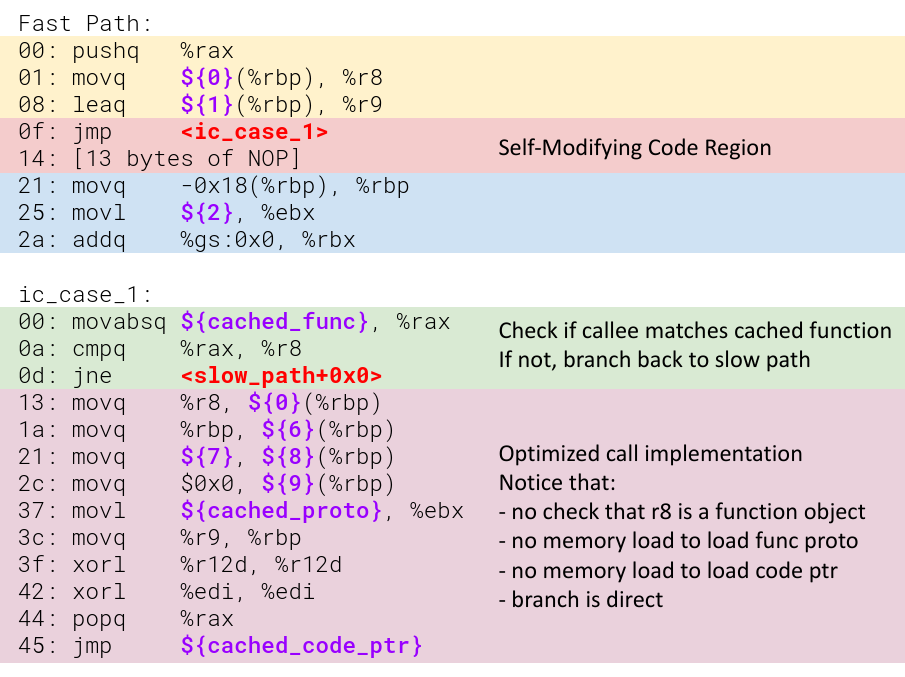
As one can see, the next time the same function is called, thanks to the SMC region, the IC will hit, and the optimized logic will be executed. The optimized logic does not check that func is a function object (because we already checked it last time), has no memory loads, and the branch is direct.
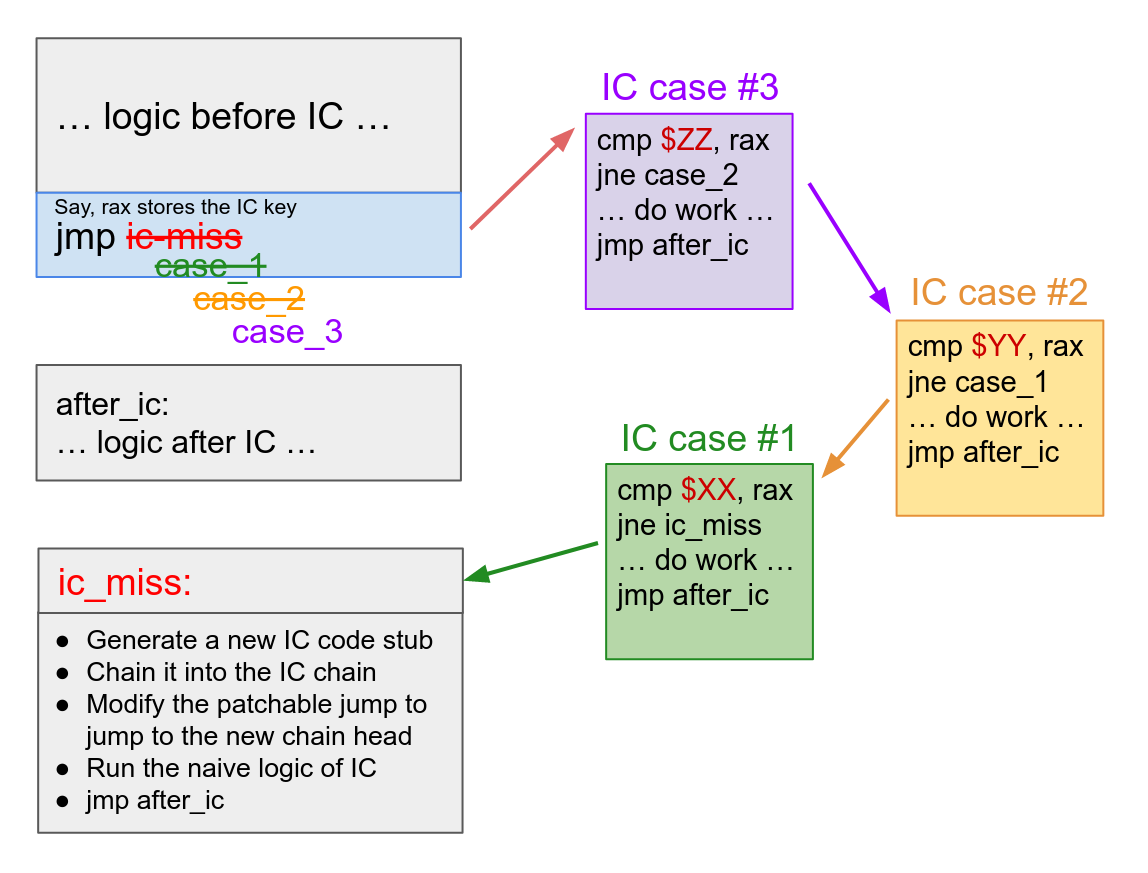
This process can be repeated to chain any number of IC entries into a chain:
- SMC region branches to IC
#N - IC
#Nbranches to IC#(N-1)if the cached value does not hit - … etc …
- IC
#1branches to the IC miss slow path, which will create a new IC snippet#(N+1)and chain it at the head of the chain.
Of course, at a certain point the overhead from the check chain would cancel out the benefit of the optimized code, and we will stop chaining more cases.
Call IC’s Direct Call Mode vs Closure Call Mode
While the above approach works well if a Lua function is used like a C function (monomorphism) or a C++ virtual method (class-like polymorphism), it would work very poorly for the function factory design pattern. For example, consider the following Lua snippet:
1 | createCounter = function() |
In this example, the call in line 9 is likely to see a lot of different function objects, even though all of them share the same prototype (the counter lambda in line 3). Since our current call IC strategy caches on the function object, not the function prototype, it is completely ineffective for this use pattern.
Again, we employ the solution used in JavaScriptCore. Our call IC supports two modes: direct call mode and closure call mode. A call IC site always starts in direct call mode, in which it caches on function objects, as we have shown above.
But when a call IC site first sees a IC miss that has the same function prototype as one of the already-cached function objects, it will transition the IC to closure-call mode. To do this, it rewrites the self-modifying code region and invalidates all existing ICs at this site, and from now on, this IC site will instead cache on the function prototypes. This is demonstrated by the figure below:
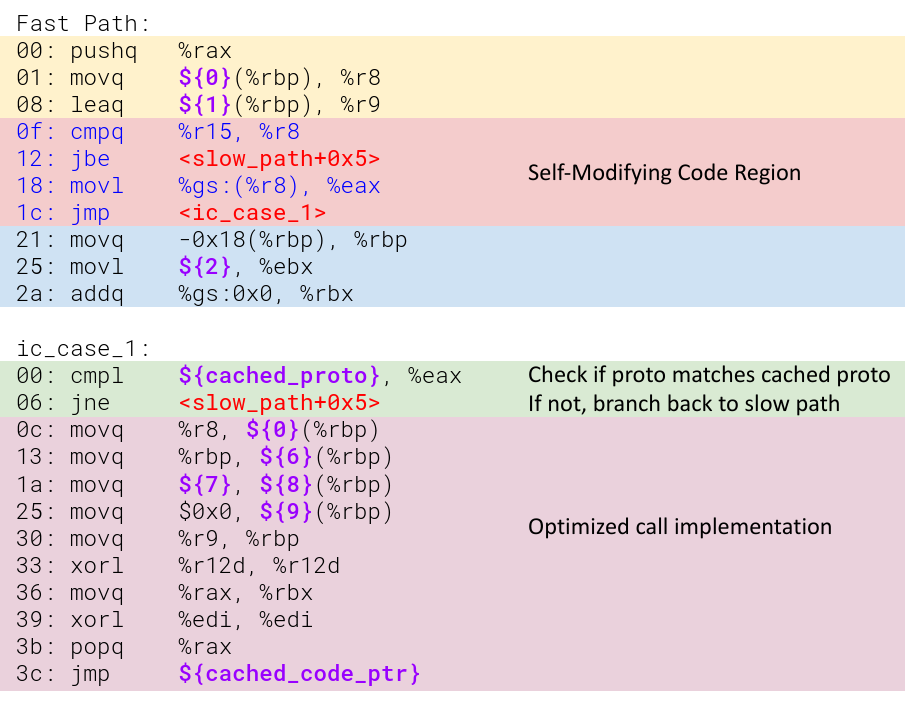
As one can see, the SMC region is repatched to completely different logic: it checks if func is a heap object (which is required for us to load its hidden class), then load the hidden class of the heap object and branch to the first IC case.
Each closure call IC case caches on a function prototype. So it compares if the hidden class matches the cached prototype. If yes, it knows that func must be a function object with the cached prototype, so it can perform an optimized call similar to before.
Of course, one can also chain up as many IC cases in closure call as desired, until the chained check overhead overwhelms the perf gain from the optimized code.
As one can see, closure call mode is less efficient than direct call mode as it performs one extra check and one extra memory load, but it works effectively for the function factory design pattern. This is why a call IC site always starts in direct call mode, and only transitions to closure call mode when it actually observes a closure call pattern.
So, How to Automatically Generate All of These?
Having understood how IC works in Deegen (we only demonstrated Call IC, but the case for Deegen’s Generic IC API is similar), the next question is: how could Deegen generate all of these automatically?
However, as you can already see, what we want to do is something totally outside the operating envelope of LLVM. LLVM is simply not designed to generate a function that can dynamically patch itself at runtime to append a dynamic chain of parametrizable code snippets.
As before, our solution is to repurpose existing tools to trick LLVM into helping us without its knowledge. And as it turns out, the core of the trick is to repurpose a completely-irrelevant little-known GCC feature in the dark corner.
Thank you, GCC ASM-goto!
GCC supports a little-known extension feature called ASM-goto, which basically allows one to write inline assembly that branches from assembler code to C labels. And LLVM, aiming for compatibility with GCC, has also supported this feature a few years ago by a special CallBr IR instruction.
I just want to say a big thank you to the GCC developers who designed this feature and the LLVM developers who added support for it! Without this feature, it’s very likely Deegen couldn’t support inline caching at all.
So how does ASM-goto have anything to do with inline caching?
As you might have seen from the assembly example above, the hard part of IC is that each IC case is a piece of machine code that directly “clings” to the main logic. It cannot be implemented by a separate function due to the call overhead and the requirements of Lua’s stackful coroutine. It must work directly using the context (e.g., which register holds which value) of the main logic, and could transfer control to different destinations in the main logic.
ASM-goto (and its underlying CallBr LLVM IR) provided exactly the semantics we want. Since it is an InlineAsm, LLVM is required to treat its contents as opaque. All LLVM knows is that after executing the InlineAsm, control will be transferred to one of the destinations specified in the CallBr.
In other words, we repurpose CallBr as a way to model “a control flow transfer in an unspecified manner”. At runtime, we are building up a dynamic chain of IC cases; but if one views the chain-check logic as a black box, then it can be characterized as: after the black box is executed, control is transferred to either an IC hit case specialized to the cached values, or the IC miss slowpath. This is exactly the semantics CallBr provided, so we can safely model it using CallBr.
But this is still far from enough. Now we have a way to model the control flow of the dynamic IC chain in LLVM IR, but it’s still unclear how we can extract the IC logic from the main function, implement the IC check chain, and do all the self-modifying code stuff.
This is where the last piece of the puzzle comes in: ASM transformation.
ASM Transformation: the Last Piece of the Puzzle
I know this might scare off people, as directly messing with assembly sounds like an extremely fragile approach.
But it really isn’t. Deegen treats most of the assembly instructions as opaque and will not modify any of them. The ASM transformation is limited to reordering and extracting ASM blocks.
As a result, Deegen’s assembly knowledge is extremely limited. All it knows is that:
- A
jmpdoes a direct jump. - A
jmpqdoes an indirect jump. - Any other instruction starting with
jdoes a conditional jump.
However, as it turns out, with some clever tricks and cooperation from LLVM IR, doing only ASM block rearrangements is already sufficient to achieve a lot: we can support all the inline caching stuffs, among other things.
The full trick is the following. Recall that we are only using CallBr as a device to express an opaque control flow, and the InlineAsm inside CallBr does not matter. So we will use this InlineAsm to carry down information to the textual assembly level, as shown below.
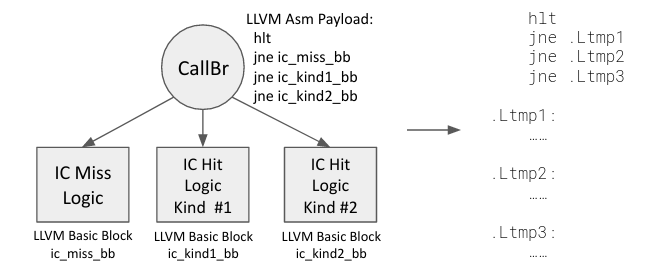
As one can see, the previledged instruction hlt is used as a magic to allow us to identify the CallBr in the textual assembly. Then, the fake branches following the hlt allows us to know the assembly labels that implements each logic case.
Having parsed these information, we no longer need the CallBr payload, so we remove it from assembly, and make it branch to the slow path directly.
Next, we perform a CFG analysis of the assembly. The only hard part about the CFG analysis is to know the possible destinations of the indirect branches. This ideally should be implemented as a LLVM backend pass, but I haven’t figured out how to do it due to limited documentation about LLVM backend. So currently, the indirect branch target analysis is done via some hacks that map the indirect branch back to LLVM IR by debug info.
Now we have the CFG of the assembly, we can then figure out the ASM blocks only reachable from the function entry, and only reachable from each IC logic kind, as shown below.
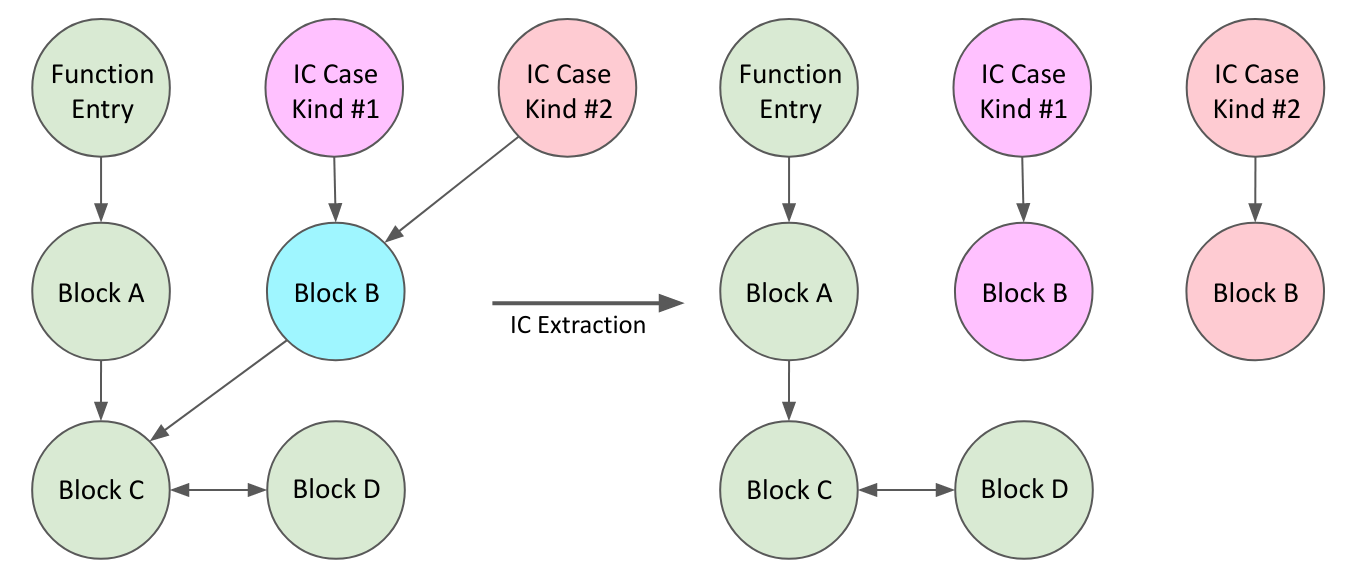
Note that the logic entry of each IC kind must not be reachable from the function entry, because they are only reachable by the CallBr, but we have removed those control flow edges as the CallBr has been removed by us.
Finally, we can separate out the IC logic from the main function logic. For the main function, we only retain ASM blocks reachable from the function entry. And for each IC kind, we only retain ASM blocks reachable from its logic entry but not the main function entry. Each piece of extracted assembly is then compiled to object file and extracted to a Copy-and-Patch stencil, so we can JIT it at runtime.
There are still some minor issues that we haven’t covered, such as how we build up the dynamic IC check chain, and how exactly the self-modifying code region is constructed. But the idea is similar to how we supported inline caching: most of the heavy-lifting of actually building up the logic is done at LLVM, and InlineAsm is repurposed as a tool to pass down information to assembly. Then at assembly level, Deegen can piece everything together by very simple transformations that requires little to no assembly knowledge.
The Inline Slab Optimization
Deegen employed one additional optimization for IC: the Inline Slab optimization (again, the terminology is a JavaScriptCore jargon).
Conceptually, the idea is very simple: currently, each IC case is an outlined piece of JIT code. As a result, control has to branch from main logic to the IC case, and then from the IC case back to the main logic in the end. So why not use the SMC region to hold one IC case? Now, the “blessed” IC case sitting directly inside the SMC region can be executed directly, saving one or two jumps[16].
Of course, it is harder to do than said. One has to decide a good size for the inline slab (i.e., the SMC region), as only IC whose size is less than the inline slab size can sit in the inline slab. And updating the patchable jump in the SMC region is more complicated, as the location of the jump is different depending on whether the inline slab exists. Finally, the inline slab version of the IC has slightly different logic from the normal version: the tail branch could potentially be eliminated, and one must pad NOPs to exactly the size of the inline slab.
As a result, even in JavaScriptCore, the inline slab optimization requires quite some engineering efforts, e.g., more hand-rolled assembly, manual book-keeping of the inline slab sizes that has to be updated whenever the generated assembly changes, etc.
Fortunately, in Deegen, the inline slab optimization is employed fully automatically. So for a language implementer, the additional ~4% performance on average (and occasionally 10+% on IC intensive workloads) from inline slab comes for free!
Runtime Support, and IC Design Summary
Finally, the VM runtime needs to manage the IC. For example, it needs to reclaim the JIT code memory when the IC is invalidated, and upon tiering-up, it needs to update all the call IC cases to point to the new entry point.
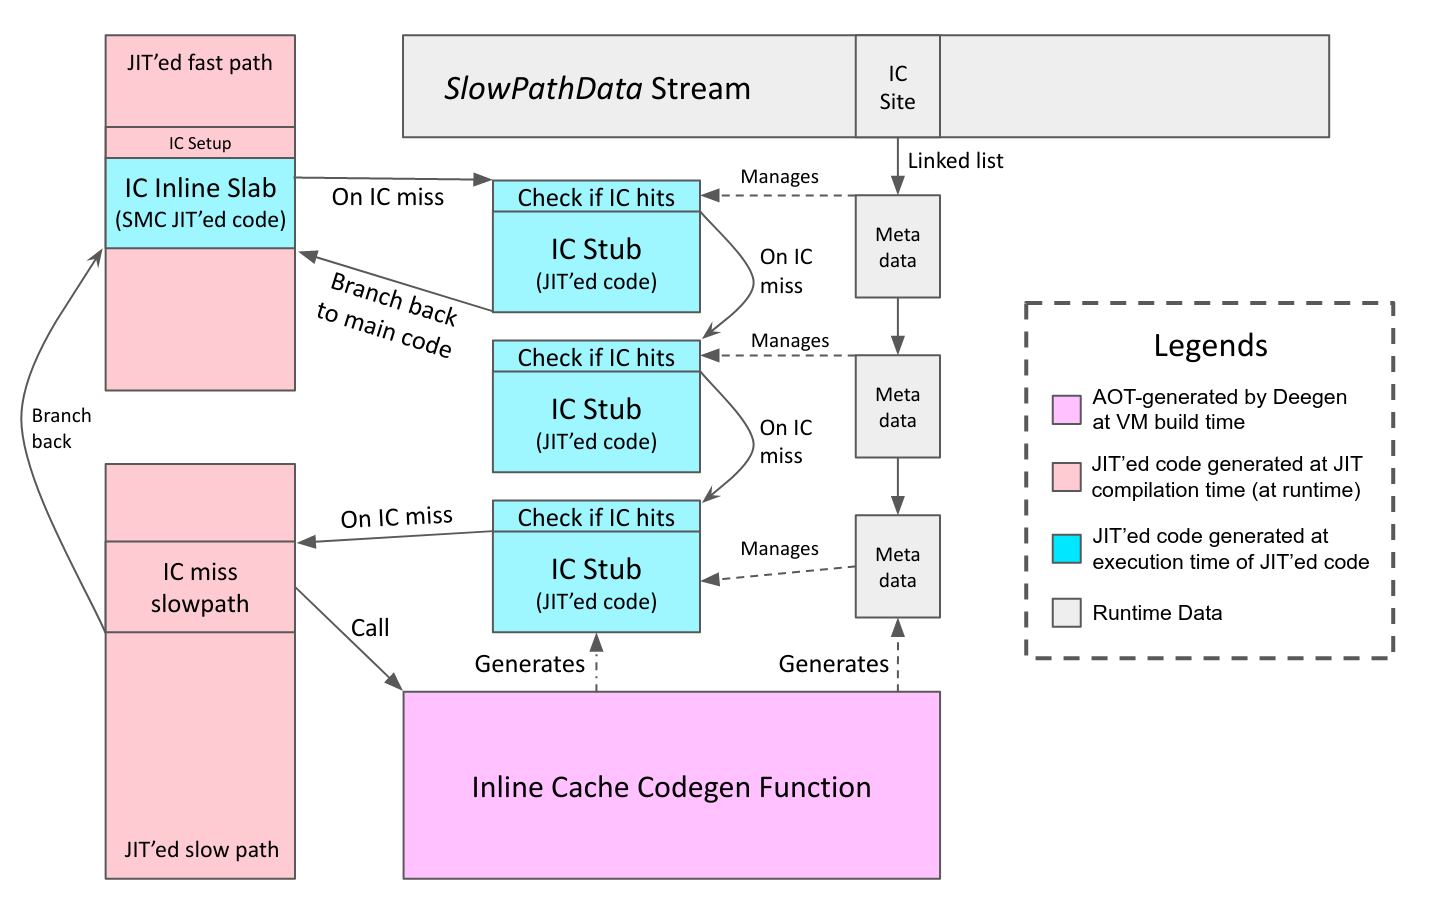
Therefore, in additional to the actual JIT’ed code, we also need to allocate a piece of metadata to manage each IC. The metadata are chained into a linked list at the use site of the IC (the ICSite), which resides in the SlowPathData stream.
Putting everything about Deegen’s IC design together into one figure:
Full Example for Deegen’s Generic IC: TableGetById Bytecode
To conclude our discussions on inline caching, we will present a full example for the TableGetById (aka., TGETS in LuaJIT) bytecode.
The bytecode takes two operands: base and index, where index is a constant string, and returns base[index]. Any Lua string property access, for example, employee.name or animal.weight, would generate this bytecode.
In LuaJIT Remake, a Lua table is not implemented by a plain hash table with an array part, but employs hidden class for better performance, using a design mostly mirroring JavaScriptCore’s. Deegen supports generic IC API to allow easy deployment of IC via clever use of C++ lambdas. The actual implementation of the C++ bytecode semantic for TableGetById can be found here.
The figure below is the disassembly of the actual machine code generated by the baseline JIT, alongside the JIT’ed code for all 6 kinds of IC stubs, as well as their inline-slab versions. As before, the runtime constants burnt into the instruction stream are shown in purple text.
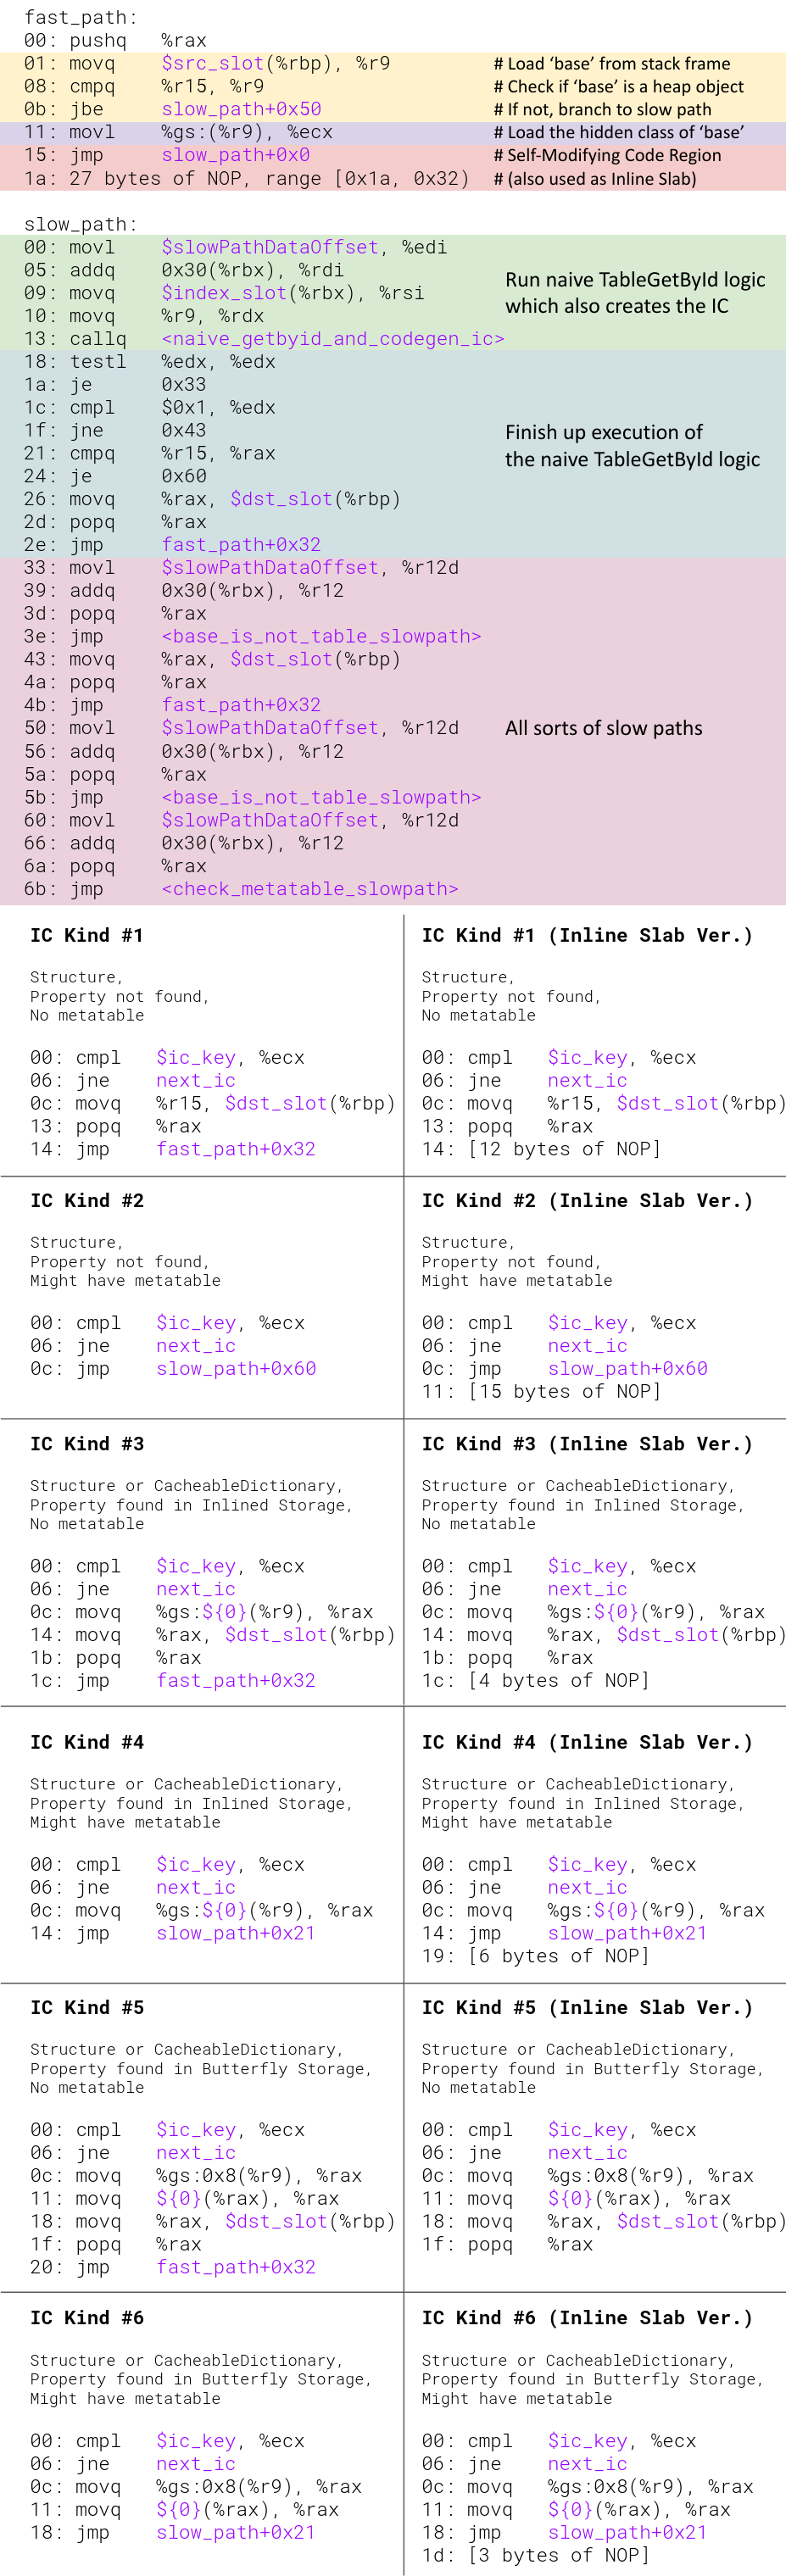
As you can see above, in the good case of an inline-slab IC hit for a table without metatable (which is very common), a TableGetById can be accomplished with no taken branches and in less than 10 instructions. This is why IC could drastically speed up table operations.
On the other hand, as you can also see above, implementing IC by hand requires a deep understanding of assembly and a significant amount of engineering. This is exactly where Deegen comes in. With Deegen’s generic IC API that makes all of these happen automatically, a language implementer can enjoy the benefits of IC without the high engineering cost.
The Hot-Cold Splitting Pass and Jump-to-Fallthrough Pass
Finally, since we already have an ASM transformation infrastructure, why not use it for more good?
The Hot-Cold Splitting Pass works by reordering ASM blocks and move cold blocks to a separated text section, which reduces some unnecessary branches and improves code locality. Of course, the stencil extraction logic that generates the copy-and-patch stencil from the object file needs to be made aware of this and extract both sections, but this is not hard to do. To figure out which blocks are cold, ideally, one should write a LLVM backend pass. However, as explained before, I still haven’t figured out how to write a LLVM backend pass, so currently this is accomplished by injecting debug info to map assembly blocks back to LLVM IR blocks, and use LLVM IR’s block frequency infrastructure to determine the cold blocks.
The Jump-to-Fallthrough transformation pass attempts to move the dispatch to the next bytecode to the last instruction, so that the jump could be eliminated to a fallthrough, reducing an unnecessary branch. This is needed because at LLVM IR level, a dispatch is a tail call, and LLVM is not aware of the fact that a dispatch to the next bytecode could potentially[17] be implemented by a fallthrough if it were the last instruction. Deegen implemented a simple pass to address this issue, which attempts to make the fallthrough possible by reordering ASM blocks and doing very limited rewrites like flipping branch conditions.
An End-to-End Example
To demonstrate how the actual end-to-end JIT’ed code generated by the baseline JIT looks like, we will use the following Lua example that computes a factorial:
1 | -- Intentionally written without 'local' so that 'fact' |
While it is a simple example, it demonstrates almost all the important things in a baseline JIT: basic operations such as arithmetic and comparison, control flow, function calls, call inline caching (automatically provided as part of Deegen) and table inline caching (implement using Deegen’s generic IC API).
The above Lua function results in 8 bytecodes:
- (Bytecode #0) BranchIfNotLessThan {
Slot(0),Double(1)} → #3 - (Bytecode #1) ConstInt16 {
1} →Slot(1) - (Bytecode #2) Return {
SlotRange [1, 2)} - (Bytecode #3) GlobalGet {
String("fact")} →Slot(1) - (Bytecode #4) ArithmeticSub {
Slot(0),Double(1)} →Slot(5) - (Bytecode #5) Call { Frame:
Slot(1), #arg:1, #ret:1} - (Bytecode #6) ArithmeticMul {
Slot(1),Slot(0)} →Slot(1) - (Bytecode #7) Return {
SlotRange [1, 2)}
For clarity, we demonstrate the code after the function has been executed, so all the self-modifying code regions (including inline slabs) have been repatched, and outlined IC stubs have been created.
I manually grabbed the JIT’ed code using GDB and hand-remapped all the labels, so please pardon me if I made an mistake. The disassembly is as follows:
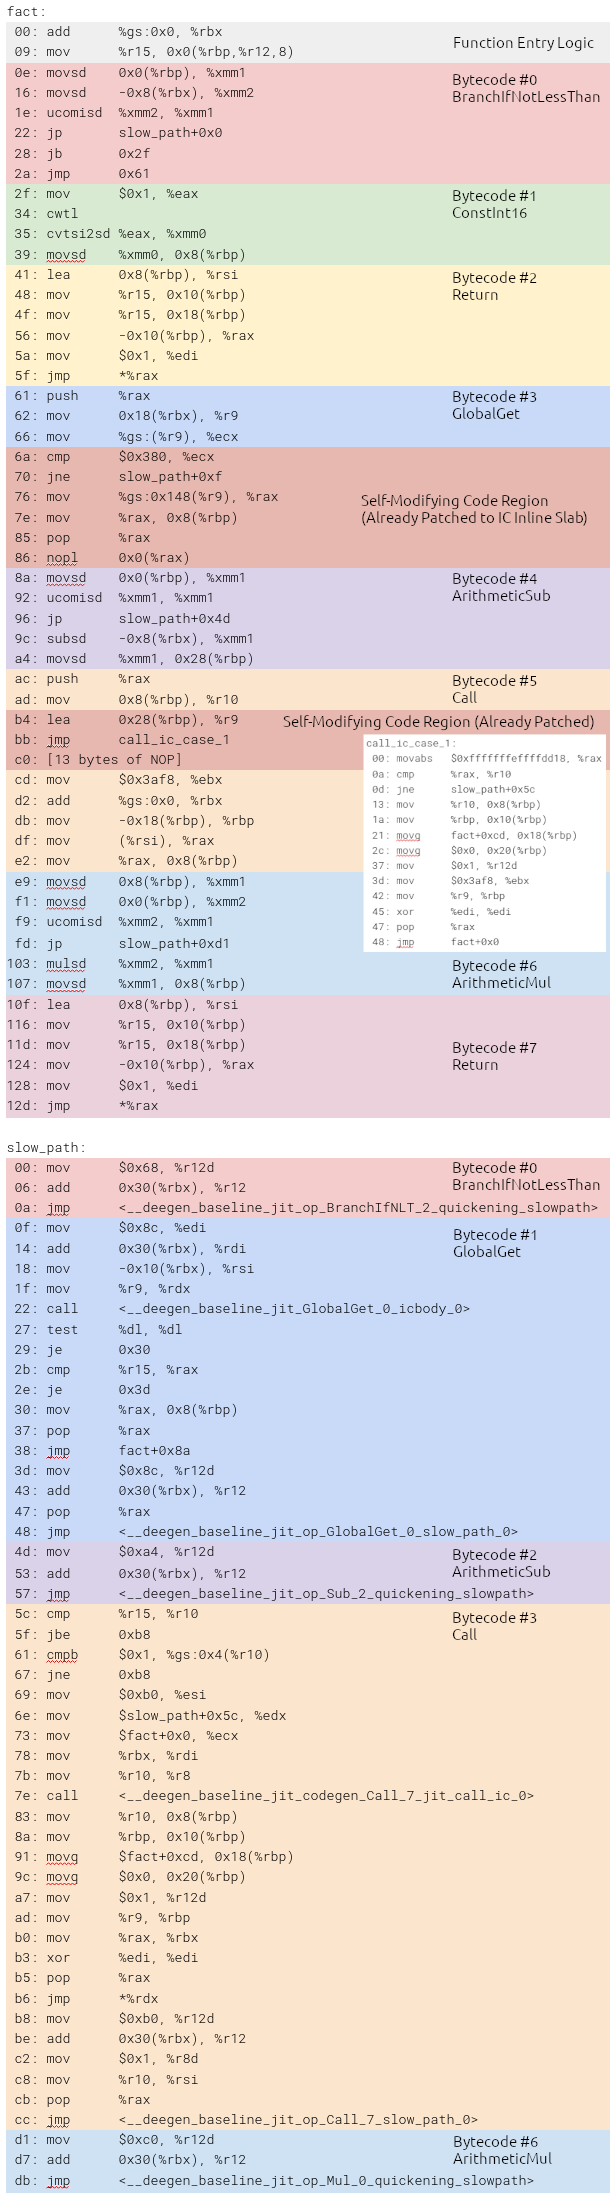
Note that under normal circumstances (i.e., a number is passed in as parameter to fact), the GlobalGet and Call slow path will be executed once to create the IC. After that, none of the slow path logic will ever be executed, and none of the self-modifying code region in the fast path will get repatched further.
Tiering-up Logic
The last bit of complexity is the tiering-up logic. In a multi-tier VM, the user program starts execution in the interpreter tier, and hot functions are eventually tiered up to the baseline JIT tier (and potentially further to the optimizing JIT tier, but that’s future work).
To support tiering-up, we have two problems to solve. First, how hot functions could be identified. Second, how future calls to the tiered-up function could get redirected to the JIT’ed version.
Let’s look at the second problem first. While seemingly trivial (just change the entry point stored in the function prototype), it is actually not that trivial due to the existence of call IC. When a function gets tiered-up, every call IC that caches on the function must be updated and redirected to the new entry point. To achieve this, all the call IC are chained into a circular doubly-linked list on the function prototype that it caches on. In addition, Deegen generates information on how one can update the JIT’ed code of a call IC to change the function entry point it branches to. Then, whenever a function is tiered up, one can iterate through all the call ICs caching on the function using the doubly-linked list, and update each of them to point to the new entry.
For the first problem, the idea is to increment a per-function counter whenever the interpreter reaches a loop bytecode or a function return bytecode. When the counter reaches a threshold, we trigger JIT compilation and redirect control to the JIT’ed code. Unfortunately, the engineering of this part has not been finished. I have to publish this post now, because this post is used as the reading material for a talk a couple of days later :(
This also means that currently we cannot tier-up from interpreter to baseline JIT, so for the benchmarks, everything is directly compiled by the baseline JIT and executed in baseline JIT tier.
Performance Evaluation
In this section, we will analyze the performance of LuaJIT Remake (LJR)'s baseline JIT on 44 synthetic benchmarks from Are-we-fast-yet, CLBG, LuaJIT Benchmarks and Lua Benchmarks.
Disclaimer: synthetic benchmarks are well-known to be misleading and unable to reflect real workloads (see [1,2,3,4]). The sole purpose of this section is to put our results within the context of the existing works, to give a rough sense on the performance of our baseline JIT.
Compilation Throughput
The top priority of a baseline JIT is to generate machine code as fast as possible. Therefore, our first evaluation is the compilation throughput.
We measured the compilation throughput of our baseline JIT by timing the main compilation function, which performs the end-to-end work of compiling a input Lua bytecode stream to machine code. We also recorded the total number of Lua bytecodes processed by the baseline JIT, and the total size of the generated machine code.
The average result over all 44 benchmarks is as follows:
- In terms of Lua bytecodes processed per second, LJR’s baseline JIT can compile 19.1 million Lua bytecodes per second.
- In terms of machine code generated per second, LJR’s baseline JIT can generate 1.62GB of machine code per second.
To demonstrate what 19.1 million Lua bytecodes means, the 44 Lua benchmark programs (254KB total) contains 17197 Lua bytecodes in total. So our baseline JIT generated machine code for all 44 benchmarks in less than one millisecond total.
As such, we claim that the compilation throughput of our baseline JIT is extremely fast, to the point that the start delay can be considered negligible[18].
Generated Code Performance
While the baseline JIT is designed to generate code fast, generating fast code is still a second priority.
In this section, we will evaluate the execution performance of the machine code generated by LJR’s baseline JIT by comparing with LuaJIT and PUC Lua.
LJR and LuaJIT have drastically different high-level architecture, mid-level design and low-level implementation choices. For the most obvious part, a baseline JIT performs few optimizations by design, while the tracing JIT in LuaJIT does a lot of optimizations. Therefore, the sole purpose of the benchmark is to put the end performance of LJR’s baseline JIT within the context of the existing works, as shown in the figure below:
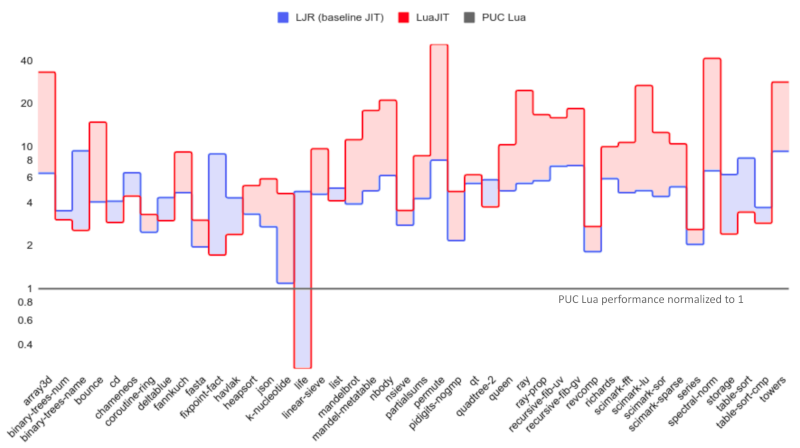
As one can see, LuaJIT’s optimizing tracing JIT generally works better than our baseline JIT, which is no surprise.
However, it’s worth noting that with IC as the only high-level optimization, we are already outperforming LuaJIT on 13 of the 44 benchmarks. On geometric average, we are about 34% slower than LuaJIT, and 4.6x faster than PUC Lua.
In my opinion, it is fair to say that Deegen is now on a very stable ground. With its excellent interpreter and baseline JIT that can already achieve pretty good execution performance at a negligble startup delay, the optimizing JIT (to come in the future) would have much less pressure in doing expensive optimizations.
Conclusion Thoughts and Future Works
This post demonstrated the second phase of the Deegen project – to build a high-performance baseline JIT compiler automatically from the bytecode semantic.
Of course, this is far from the end. Our next step is to automatically generate an optimizing compiler, which will likely follow the design of JavaScriptCore’s DFG lightweight JIT compiler. If you have any comments, suggestions or thoughts, please do not hesitate to shoot me an email :)
Acknowledgements
I thank Fredrik Kjolstad and Saam Barati for their comments and discussions on the draft version of this post. Fredrik also did the image editing work for the Add bytecode figure.
Footnotes
Since a JIT compiler works at runtime, the overall latency experienced by the user is the sum of the compilation time to generate the code (startup delay) and the execution time of the generated code. So for maximum throughput, one wants a multi-tier architecture. The baseline JIT is a JIT compiler that specializes at fast compilation, and is used to compile not-so-hot code. For a small set of hot functions identified by the baseline JIT, the optimizing JIT kicks in to generate better code at a much higher compilation cost. ↩︎
And even worse, due to the nature of assembly, there is little code sharing across the VM tiers or across hardware architectures, despite that all the VM tiers must stay in sync and exhibit identical behavior, or you get a VM bug. ↩︎
There are other reasons from the usability and engineering side as well. For example, by removing the “compile” step in the edit-compile-run cycle, dynamic languages have faster iterative development cycle. And libraries written in dynamic languages can be distributed as source code. ↩︎
Directly translating a dynamic language program to native code will result in a huge amount of native code. This is mainly due to the dynamic typed nature: every innocent operation in dynamic language is actually a huge switch depending on the input types, and can have drastically complex slow paths. The statically-generated logic must deal with all such cases for correctness, even though most of the slow paths are never hit at runtime. ↩︎
Recall that in most dynamic languages, functions are first-class value. So the function held by
fcan always be changed (and in fact,fis not even necessarily a function object), even though in the majority of use cases, the function is used like a C function sofalways just hold the same value. ↩︎This is the simplest strategy, but one can clearly do some fancier stuffs here. For example, JavaScriptCore will generate a binary search tree to reduce the number of jump instructions executed, so that they can support a higher number of IC entries. However, based on words from JSC developer, this optimization has very limited effect in practice. ↩︎
OSR stands for On-Stack Replacement. OSR-Exit is also more widely known as deoptimization, a technique originally used to enhance the debuggability of optimized code. However, we will stick to the term “OSR-Exit” as it better reflects the nature of this technique in the VM use case: exiting to a lower tier using an exotic method (on-stack replacement). ↩︎
Being an acute reader like you, I’m sure you can already imagine a primitive JIT that works by wiring up different functions that implement basic functionalities like constant, addition, pointer dereference, etc. ↩︎
While seemingly scary to mess up with assembly code directly, one can easily prove the correctness from the semantics of
jmp. ↩︎Acute readers might have noticed that this statement is not 100% true. We will revisit it later. ↩︎
Note that here, by saying register allocation and instruction selection, we meant those that work across stencils. Inside a stencil, since the code is compiled by LLVM, we already have good RA and ISel. ↩︎
The decision to give up non-local RA/ISel is justified by designs of existing state-of-the-art VMs. For example, in JavaScriptCore, only the fourth-tier heavyweight optimizing JIT (FTL) employs codegen-level optimizations (RA, ISel, etc.) that works across bytecode or DFG IR nodes. ↩︎
Unfortunately, I never realized the larger picture until after the Copy-and-Patch paper was already published, so this wrong belief is also published with the paper… ↩︎
Under small code model, and not considering complications like position-independent code (PIC) and position-independent executable (PIE). ↩︎
This is in fact an exaggregated statement. Hidden class without inline caching is much slower than a naive implementation (i.e., no hidden class at all). Therefore, if one were to actually seriously implement a baseline JIT without inline caching, he/she wouldn’t employ hidden class either. So IC is only responsible for a portion of the “>100% speedup on IC-intensive benchmarks”: the rest are the slowdown from the overhead of hidden class that could be avoided. ↩︎
One jump is clearly saved by not branching to the outlined JIT stub. If the IC happens to fallthrough to the logic directly after the SMC region (which is quite common), an additional jump can be saved. ↩︎
Note that the JIT code for a bytecode may consist of multiple stencils, for example, a
Callneeds both the main logic and the return continuation. Clearly, the jump-to-fallthrough transform is only valid for the last instruction of the last stencil for the bytecode. ↩︎However, note that the memory overhead is not negligble at all: each Lua bytecode (which is usually a few bytes) expands to an average of 91 bytes of machine code in baseline JIT. This is why even with a baseline JIT, we still want programs to start executing in the interpreter. ↩︎