Some day last week, I was writing code for my research project as usual.
I made some innocent code changes, then the build failed, with a weird linker error reloc has bad offset 8585654 inside some debug info section.
I’ve never hit such an error before, and Google gives no useful results either. The error clearly looks like a toolchain bug. So I didn’t think too much, cleared ccache, and ran the build again. This time, the build finished without problem.
Then a few days later, my code got a weird failure while running a benchmark. All the tests were passing (which also includes that benchmark on a smaller dataset), but on the real benchmark dataset the code failed.
I rolled back a few git commits, but the failure persists. Finally, I rolled back to a known “good” commit where I have ran the benchmark with no problem in the past. And the benchmark is now failing.
Now it is clear that the failure is caused by a configuration issue. On closer look, it turns out that the benchmark reads from a 50MB data file FASTA_5000000. The file is not tracked by git due to its size, and the benchmark script will generate the file if it does not exist.
I happen to have a copy of this file in another folder, so I ran diff on the two files.
To my surprise, diff found a difference! Specifically, exactly one byte of the two ~50MB files is different. The byte went from 0x41 (the letter A) to 0xc1, i.e., its 7-th bit is flipped.
Of course, the file is never modified since its creation many months ago. And given that exactly one bit was changed, my first thought is the urban legend that a cosmic ray striked my electronic and caused the bit-flip.
Checksum Revealed More Errors
I’m not a fan of urban legends, but having witnessed such a weird bug myself, I decided to take preventative measures. I decided to migrate my disk to Btrfs, a file system that (among other things) provides built-in checksum checks for all data and metadata. This way, any corruption should be automatically detected.
Then I discovered the situation isn’t that simple.
I used btrfs-convert to convert my filesystem from ext4 to btrfs. By default, it creates a snapshot file named image that allows one to rollback to ext4. After the conversion finished, for sanity, I ran btrfs scrub to scan for disk errors. To my surprise, btrfs scrub immediately reported 288 corruptions in the image file!
It is clear that something is seriously wrong. Maybe I got a defective SSD that is already at its end of life after only 1 year of use? So I checked my SSD’s smartctl log, but saw no errors.
Of course, it could be Western Digital didn’t faithfully implement their SSD error logging. But I suddenly realized another possibility.
All the corruptions I observed are disk-related (the ccache, the benchmark data, the image file), but the faulty hardware doesn’t have to be the disk. The corrupted benchmark data is especially misleading: I observed a flipped bit with my own eye. But even that could be explained by a RAM corruption: Linux has a page cache that caches disk contents. If the page cache is corrupted, then even though the disk file is intact, all the reads will see the corrupted contents until the corrupted page is evicted.
So before I conclude that WD is not trustworthy and go buy a new SSD from another manufacturer, I need to make sure that the problem is indeed my SSD.
So I looked into the kernel dmesg log just to see if there’s anything interesting. Luckily, I soon noticed another unusual error, which complains some page table entry is broken for some process. This is a corruption that cannot result from a user-level software bug (as the page table is managed by the kernel), and it has nothing to do with the disk (unless the page table is swapped out, which is unlikely). The RAM is quickly becoming the top suspect.
Hunting down the Faulty RAM Chip
I ran memtester to test my RAM, but no errors are found. And given that I can just use my laptop as usual, even if there were a hardware glitch, it’s likely that the glitch could only be triggered very rarely in complex conditions.
So to pinpoint the faulty component, I need a way to reliably reproduce the bug. btrfs-convert can, but I can’t run the command repeatedly (and at the risk of my file system).
Fortunately I soon found such a reproduce. I was trying a tool called duperemove, as recommended by the Btrfs guide. The tool needs to scan the whole filesystem. As the tool was running, I soon noticed file corruption errors popping up in dmesg:
It turns out that if I run duperemove in a dead loop, those errors show up sparsely, from once per few minutes to once per couple of hours.
Furthermore, the files on the disk are actually not corrupted. The ino in the error messages can be backtracked to the file path using btrfs inspect-internal inode-resolve, and there’s no issue to read the file contents again (note that Btrfs cannot fix corruption as my disk is not RAIDed, so if the file is actually corrupted, every read will fail). This is a strong evidence that my SSD is innocent: the faulty hardware is the RAM.
Fortunately, I have a spare old laptop, so I replaced the RAM using the one from the old laptop. After that, duperemove no longer results in dmesg errors.
To be extra sure, since my new laptop has two RAM chips, I also tried to only install one of them. As expected, duperemove triggers error when one of the two RAM chips is installed, but not the other one.
This clearly demonstrates that the faulty component is one of my two RAM chips:
But I’m replacing both chips anyway, as I don’t trust Corsair anymore – to be clear, the chip has served 5 years, so it’s hard to say that their quality is low. But as you can imagine, after all of these, I just don’t want to take any more risks.
Takeaways
We all know faulty hardwares are real: after all that’s why server RAMs have ECC and disks are RAIDed. Even CPUs can malfunction, as shown by Google’s paper.
But it feels completely different to experience a faulty hardware first-hand. For example, I used to believe that if my RAM became faulty, my computer won’t even boot, so why worry about ECC? But I have totally changed my mind now.
To summarize:
Hardwares are not always reliable.
Hardwares can fail in subtle ways: my faulty RAM worked just fine for normal daily usage, but in complex workloads (compilation, benchmarking, file system convertion) it silently failed and caused data corruptions.
Error detection and recovering techniques like checksum, RAID and ECC are not just for the paranoids: they are there for good reasons.
Building a good VM for a dynamic language takes a ton of engineering. The best-performing VMs (e.g., JavaScriptCore, V8, SpiderMonkey) employ at least 3 VM tiers (interpreter, baseline JIT[1] and optimizing JIT), and pervasively use hand-coded assembly in every VM tier[2]. Optimizations such as inline caching and type speculation are required to get high performance, but they require high expertise and introduce additional engineering complexity.
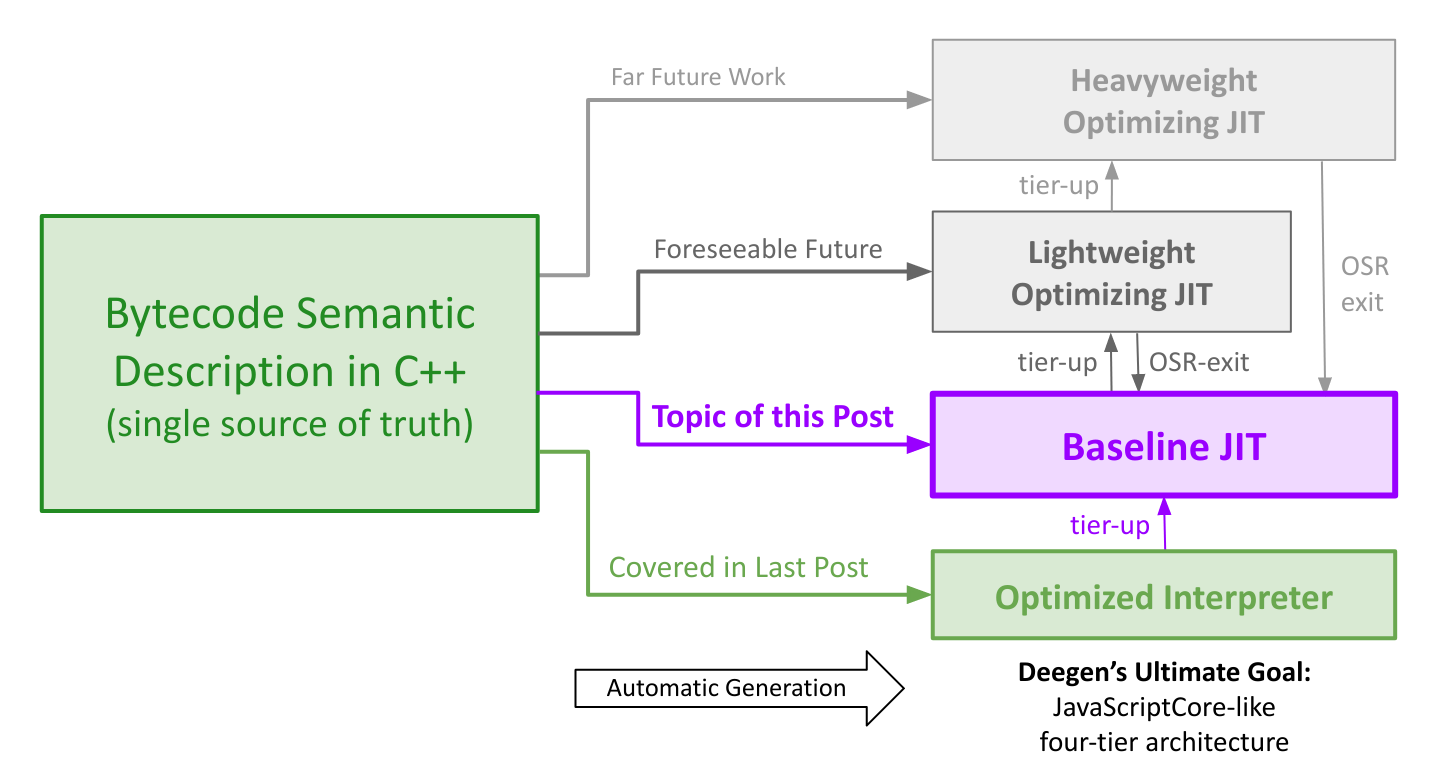
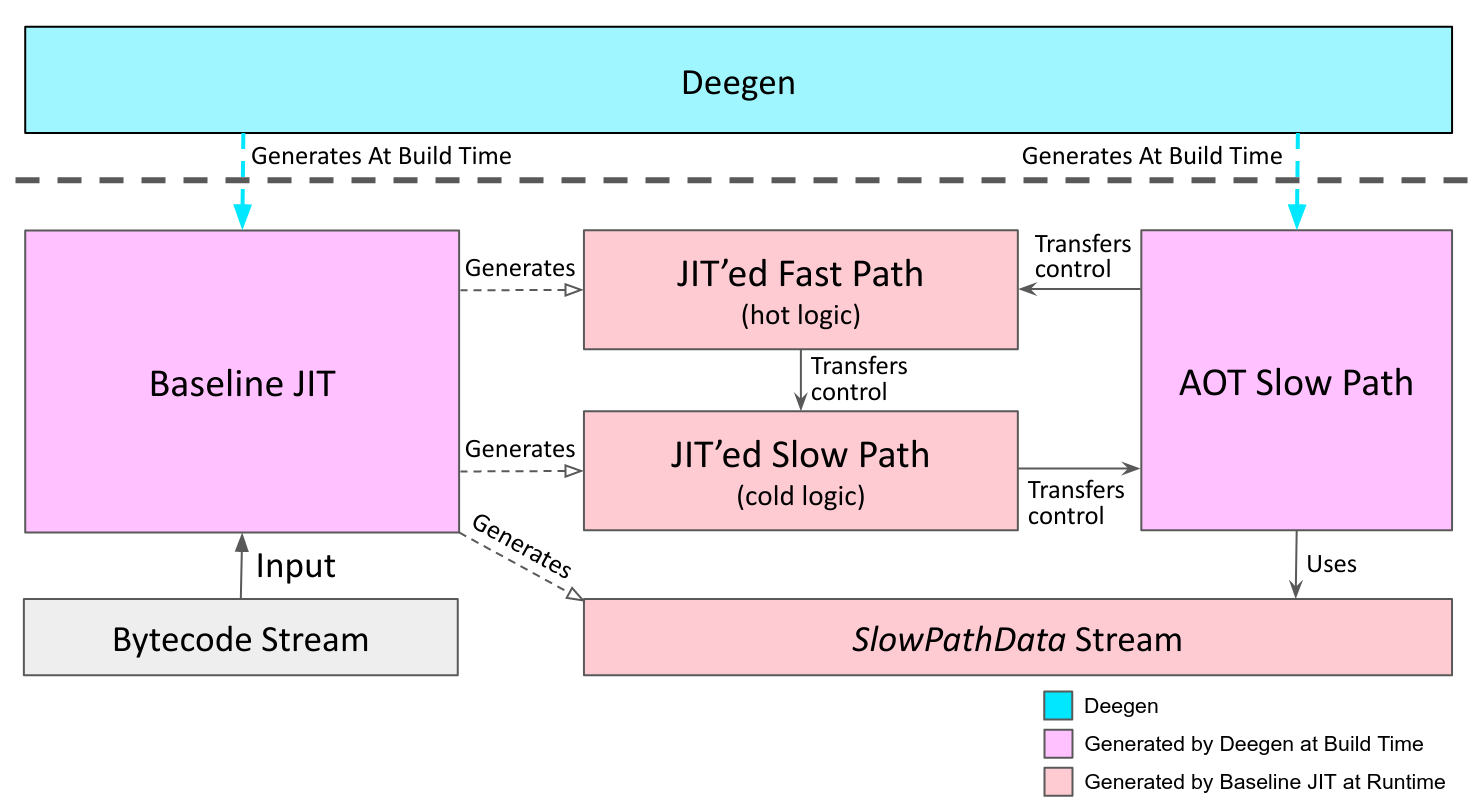
Deegen is my research meta-compiler to make high-performance VMs easier to write. Deegen takes in a semantic description of the VM bytecodes in C++, and use it as the single source of truth to automatically generate a high-performance VM at build time, as illustrated below.
In a prior post, we used Deegen to automatically generate the fastest Lua 5.1 interpreter to date, outperforming LuaJIT’s interpreter by an average of 34% across a variety of Lua benchmarks. The VM was named LuaJIT Remake, even though it had no JIT tiers at that time.
Today, after months of additional work, LuaJIT Remake is finally a JIT-capable VM. It is now equipped with a state-of-the-art baseline JIT compiler, also automatically generated by Deegen. The baseline JIT features:
Extremely fast compilation speed.
High-quality machine code (under the design constraints of a baseline JIT).
Automatic call inline caching (IC) with two modes (direct/closure call).
Self-modifying-code-based IC implementation for best performance.
Hot-cold-splitted JIT code for less branches and better code locality.
It is important to note that the baseline JIT is generated from the same bytecode semantic description that Deegen uses to generate the interpreter. Therefore, for a language implementer, the baseline JIT comes for free:
No need to have any assembly knowledge.
No need to manually engineer the JIT.
No need to manually keep the JIT updated with new language features.
Because Deegen does all the work automatically!
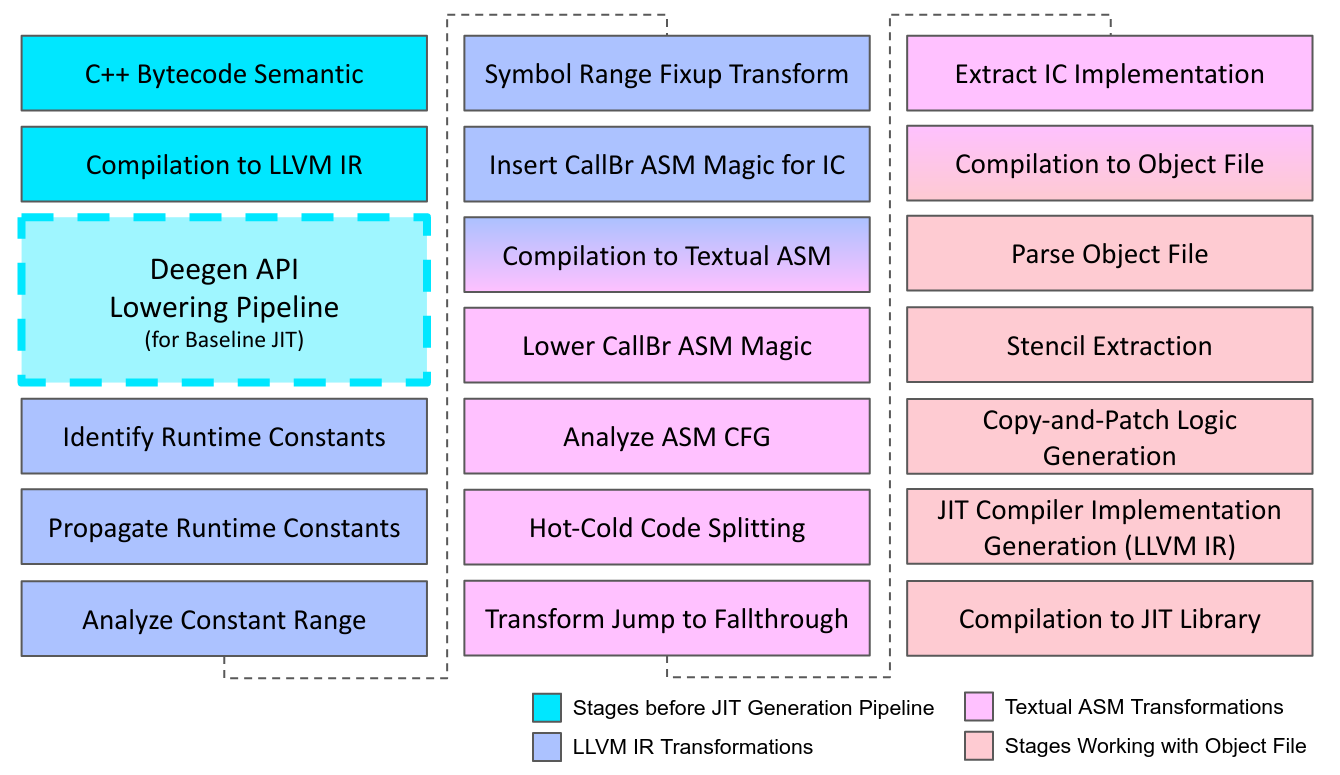
Of course, this is no easy feat. In order to generate the baseline JIT automatically, a sophiscated build-time pipeline is employed, as illustrated below.
As a side note, LLVM is only used at build time to generate the JIT. The generated baseline JIT is self-contained, and does not use LLVM at runtime.
At runtime, the generated baseline JIT generates machine code using Copy-and-Patch (we’ll cover it in a minute). Except that, it heavily follows the design of the baseline JIT in JavaScriptCore, and has employed most of their optimizations. As such, we claim that our baseline JIT qualifies as a state-of-the-art.
In the rest of the post, we will explore the internals of how Deegen generates the baseline JIT in more detail. It is organized as follows:
A gentle introduction of the relavent backgrounds (VM, JIT, IC, etc.).
An overview of the Copy-and-Patch technique, the core tool employed by the generated JIT to generate machine code at runtime.
How Deegen further extends Copy-and-Patch to fully automate the process and fit it for the domain-specific use cases of dynamic languages.
An end-to-end example of the machine code generated by the baseline JIT.
Performance evaluation and conclusion thoughts.
Background
Not everyone is familiar with topics like modern dynamic language VM, multi-tier JIT compilers, baseline JIT, speculative compilation, inline caching, OSR exit… Therefore, I prepared a background section to gently introduce the background contexts for this post.
Before we start, let’s cover some backgrounds about dynamic languages, VM and JIT compilation. It might be a bit lengthy, but IMO this topic is really a piece of little known gemstone and worth elaboration. If you are already familiar, feel free to skip to the next section.
AOT Compiler, JIT Compiler and Multi-tier JIT Compiler
Unlike static languages such as C/C++, which are ahead-of-time (AOT) compiled to a native executable, programs written in a dynamic language have to execute in a virtual machine (VM). You might ask: why can’t we AOT compile them to native code like C/C++? The main reason[3] is that it is impossible to statically generate efficient native code from a dynamic language program. As shown by HPHPc and the early days of HHVM, forcefully doing so is simply not worthy: one could get a small performance gain, but it comes at a huge memory overhead[4].
Nevertheless, interpreters are intrinsically (much) slower than native code. That’s where Just-in-Time (JIT) compilers come in, which identifies the hot part of the dynamic lanugage program, and dynamically compile it to native code at runtime. By doing compilation at runtime and for hot code only, performance is improved without sacrificing the advantages of dynamic languages.
However, since JIT compilation happens at runtime, the time spent by the JIT compiler to generate the code (startup delay) is directly reflected in the total execution time. And there is no free lunch: in order to generate even slightly better code, one must spend a lot more time in compilation.
The result of this game is the multi-tier JIT strategy. A baseline JIT compiler, which excels at fast compilation but only generates mediocre code, is used to compile functions as soon as they reach a low hotness threshold. Then, for functions that eventually gets really hot, the optimizing JIT compiler kicks in to generate better code for these function at a much higher compilation cost.
Orthogonal to the multi-tier JIT strategy, another equally important concept in modern dynamic language VM is speculative compilation. Recall that dynamic language programs cannot be AOT-compiled to efficient native code. Speculative compilation is exactly how JIT compilers made it possible.
There are two forms of speculations: inline caching and type speculation.
Inline Caching
Inline caching (IC) works by predicting the value of certain operands. For example, for the code f() which calls f, it’s likely that every time this line of code is run, the function object f always holds the same function[5]. So the JIT, after having seen the value of f once, may predict that future executions will see that value again, and speculatively devirtualize the call to a direct call.
Every VM tier can benefit from IC, including the interpreter. However, IC is most powerful at the JIT tiers, as the ability to JIT code allows one to produce the most specialized code without any unnecessary overhead.
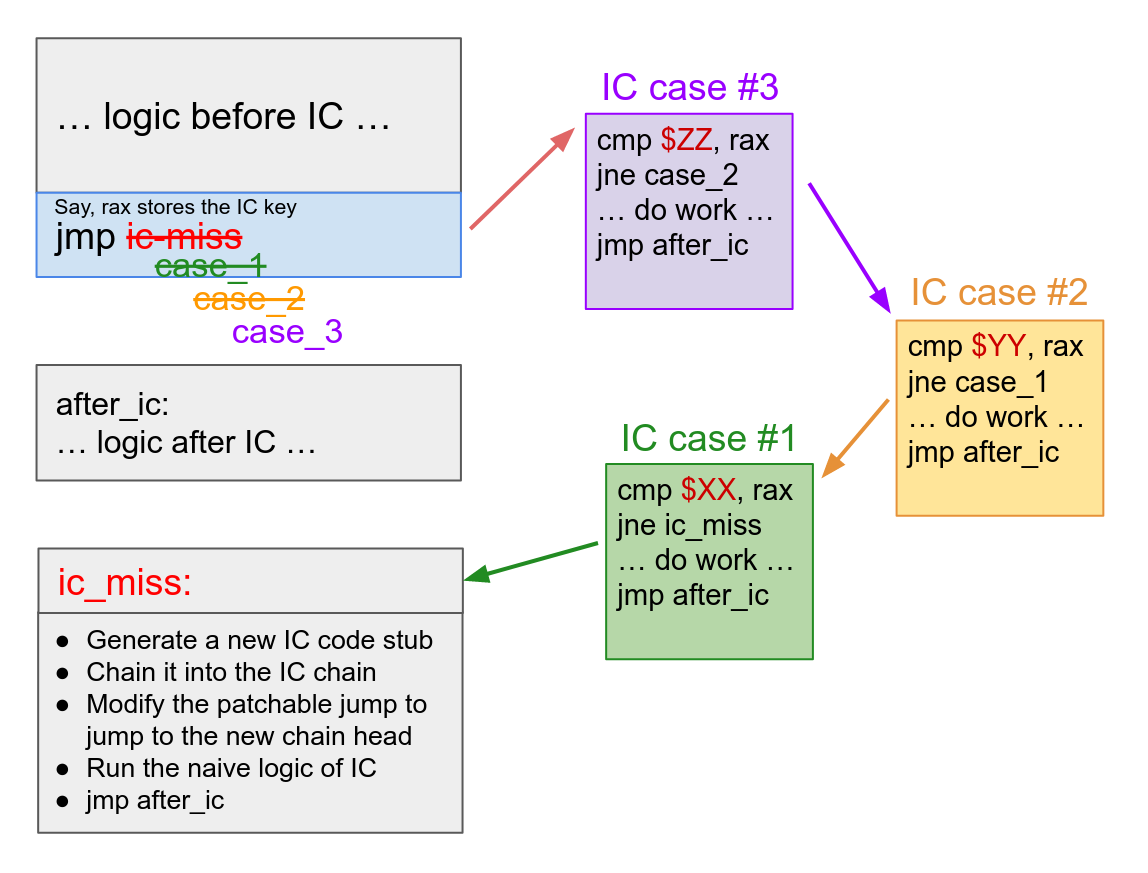
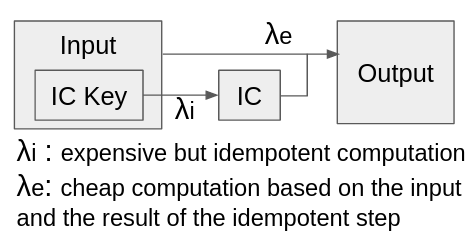
At machine code level, the most efficient implementation of IC requires the use of self-modifying code. The idea is like below:
The blue region indicates the self-modifying code, where in this example it is simply a patchable jmp instruction. Initially, there are not any IC cases, and the patchable jump simply jumps to the IC-miss slow path.
When the code is executed for the first time, the patchable jump will bring control to the IC-miss slow path. The IC-miss slow path will JIT compile a piece of code stub containing the specialized logic based on the IC key it sees (the “IC case #1” in figure), and repatch the jmp instruction to jump to the code stub instead. So next time, if the code is executed with the same IC key, control will reach the JIT’ed code stub and the specialized fast path will be executed.
This process can be repeated. All the JIT’ed IC code stubs are chained together, so that if the first code stub misses, control will be transferred to the next one[6], and the last one transfers control to the IC miss slow path, which will JIT-compile a new code stub and chain it into the stub chain.
Inline caching allows one to speculatively generate optimized code based on the prior executions, largely alleviating the overhead from the dynamic nature of dynamic languages.
Inline caching is especially powerful when combined with hidden class, which uses a hash-consed meta-object (the hidden class) to identify objects with the same layouts. With IC and HC, object property access can often be speculatively simplified down to a few instructions.
Type Speculation and OSR-Exit
Type speculation is another important speculative optimization. Unlike inline caching, which only speeds up the internal execution of a bytecode and has no global effects, type speculation works across bytecodes, and can drastically simplify the logic of a function.
As the name suggests, type speculation works by predicting the type of certain operands. It relies on the following observation: in most practical programs, the operand types at a given program site are predictable. For example, it’s rare that an a + b is executed in a loop where a is sometimes a number, sometimes a string, and sometimes an object.
Now, if we speculate that an a + b at a program site is likely a numeric add, we will check at runtime that a and b are numbers. However, crucially, if the check fails at runtime (which is unlikely), we will not branch to a slow path. Instead, we bail out from the optimized JIT’ed code, and continue execution in an unoptimized lower VM tier – this is called an OSR exit[7].
It is important to understand the difference between an OSR exit and a slow path: in an OSR exit, we bail out from the optimized function and never return to it, whereas a slow path would return control back to the optimized function. Thanks to OSR-exit, the compiler is safe to do optimizations after a + b based on the assumption that a + b is a numeric add (so that it knows a and b must be numeric, and a + b has no side effects, for example): if the assumption turns out to be false at runtime, since we will bail out from the code, none of the later code relying on the false assumption will be executed.
Type speculation and OSR exit open up opportunities for more optimizations. For example, consider c = a + b; d = a + c. If a + b is speculated to be a numeric add, we know for sure a, b and c must be numbers after the operation (as otherwise we would have OSR-exited). So now we know for sure the expression a + c is also a numeric add, so it needs no type check at all.
Nevertheless, as one can see, type speculation requires expensive analysis of the function, and introduces the complexity of OSR exit. Therefore, type speculation is typically only performed at the optimizing JIT level. Since the focus of this post is the baseline JIT, we will leave the details of type speculation, OSR exit, and the many different optimizations that they enabled to a future post.
Modern Dynamic Language VM Architecture
Finally, we have gathered enough background to understand how the architecture of modern dynamic language VMs are reached.
First of all, we need an interpreter – there is no reason to afford the startup delay and high memory overhead to compile everything to native code.
Next, we need a baseline JIT tier. The baseline JIT tier is designed to compile fast, so we must not perform expensive optimizations such as type speculation. As a side result, the baseline JIT’ed code is generic: it will never need to OSR exit to the interpreter. This not only eliminates a major complexity, but also allows the optimizing JIT tier to OSR exit to the baseline JIT tier, instead of the interpreter.
The baseline JIT will perform inline caching (IC) optimization, though. As a local optimization that only affects internally how a bytecode is implemented, IC does not slow down compilation speed, while bringing significant performance benefits on its own.
Furthermore, IC collects accurate information about the prior executions, which can be used by the optimizing JIT to do further optimizations. For example, if the optimizing JIT noticed that a call IC only has one entry, which means the call site has only ever seen one target, the optimizing JIT can speculatively inline the call target, which would then expose lots of further optimization opportunities.
Then comes the optimizing JIT tier. Type speculation and OSR-exit form the foundation of optimizing JIT. With type speculation, the compiler can safely assume that certain values have certain type. This allows the compiler to eliminate unnecessary type checks, and without the dynamism factor from dynamic typing, many traditional optimizations designed for static-typed languages can apply.
Modern VMs also employ an optimization called watchpoints, which are external speculative assumptions that the optimizing JIT may assume to be true. When a speculation failure or watchpoint invalidation happens, the JIT’ed code will OSR exit to the baseline JIT tier. This is a lot harder to do than said. However, to keep this post focused, we will leave the details to a future post.
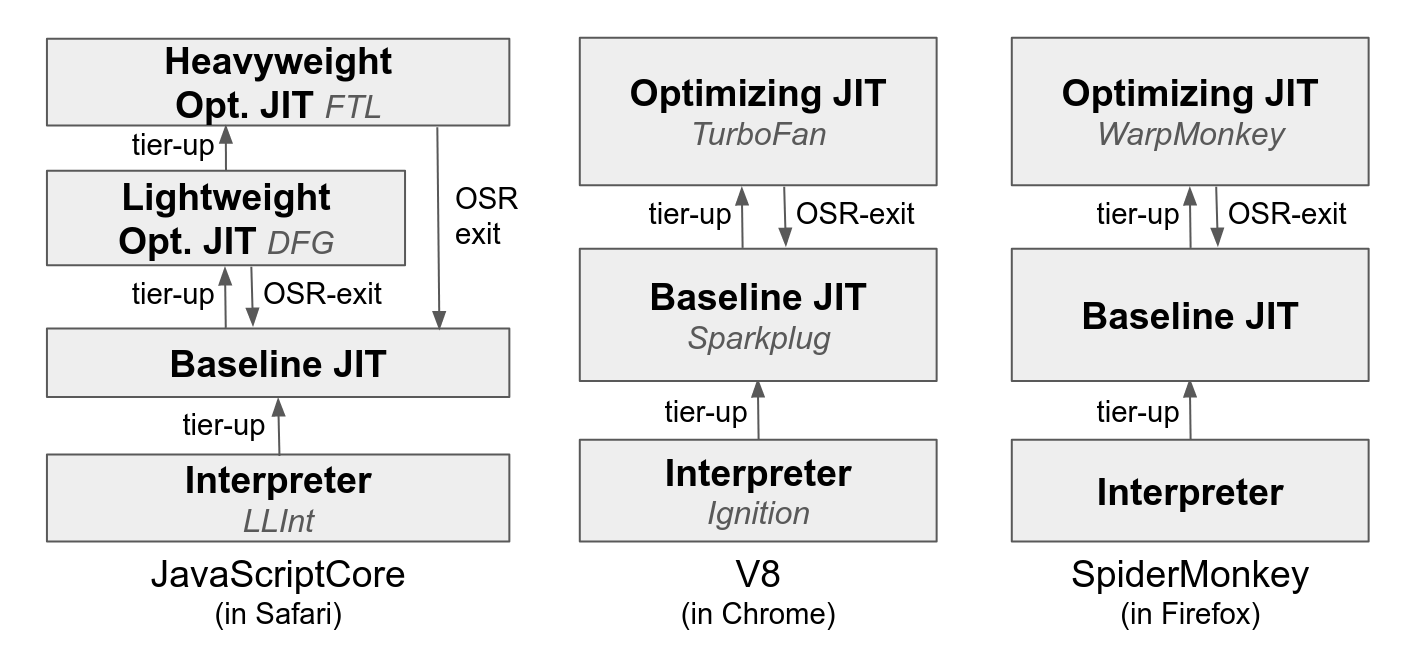
Most of the state-of-the-art VMs, such as JavaScriptCore, V8, SpiderMonkey, and ChakraCore (RIP), have converged to a high-level architecture similar to what is described above, as illustrated in the figure below.
Specifically, the input program starts executing at the interpreter tier, and hot code eventually gets tiered-up to the baseline JIT tier.
The baseline JIT’ed code is generic, and will never OSR exit to the interpreter. Apart from the JIT’ed code (which gets rid of the overhead of decoding bytecode operands and the indirect dispatch), the baseline JIT tier employs inline caching as the only main optimization.
For the code that gets even hotter, the optimizing JIT tier kicks in. The optimizing JIT does more aggressive optimizations, and generates speculatively optimized code that could OSR-exit into the baseline JIT tier.
Deegen: Motivation, Vision and Current State
While the multi-tier architecture explained above is undeniably elegant and achieves high performance, it comes at a very high engineering cost.
Under current implementation techniques, hand-coded assembly is ubiquitous in each VM tier. There is little code sharing across tiers or across target hardware platforms, but all of them must be kept in perfect sync and must faithfully implement the semantics of the language in every edge case. As a result, for developer groups not backed by tech giants, the engineering cost from such a complex architecture is unaffordable.
Deegen is designed to reduce the high engineering cost via a more systematic approach. The ultimate goal of Deegen is to automatically generate all the VM tiers from a single source of truth – a semantical description of the VM bytecodes written in C++, as illustrated in the figure below.
By generating the VM automatically, Deegen allows any language developer to enjoy the benefits of the high-performance modern multi-tier VM architecture, at an engineering cost similar to writing a naive interpreter.
To evaluate Deegen’s capability in practice, we implemented LuaJIT Remake, a standard-compliant experimental VM for Lua 5.1.
In a prior post, we demonstrated how we used Deegen to automatically generate a highly-optimized interpreter for LuaJIT Remake, which significantly outperforms LuaJIT’s hand-coded-in-assembly interpreter across a variety of benchmarks.
In this post, we will step further and demonstrate how Deegen could be used to automatically generate a highly-optimized baseline JIT tier for LuaJIT Remake from the same bytecode semantical description.
How to Generate Machine Code?
For every JIT, this is an unavoidable problem: how do you generate machine code?
A typical solution used by many (JSC, V8, LuaJIT, etc) is a hand-coded assembler. The assembler provides APIs (e.g., EmitMovRegReg64) to the JIT, which the JIT uses to emit assembly instructions as machine code one by one.
However, such an approach is clearly infeasible for a meta-compiler like Deegen, as our input is expressed as C++ bytecode semantics.
So can we use LLVM directly at runtime to generate code? Unfortunately this is also impractical, as LLVM’s compilation speed is too slow even for a heavyweight optimizing JIT, not to mention a baseline JIT where fast compilation is a top concern.
Copy-and-Patch: the Art of Repurposing Existing Tools
When the C++ compiler compiles the above code, it knows nothing about the definition of evaluate_lhs and evaluate_rhs. But it can somehow produce an object file, and the linker can link the object file to any definition of evaluate_lhs and evaluate_rhs, and the final executable would just work.
Relocation = Code Generation
What does it mean? The object file must contain structured information on how to link evaluate_add against any definition of evaluate_lhs and evaluate_rhs. So if we parse the object file to get that info, at runtime, we can act as the linker, and “link” evaluate_add against any runtime-known evaluate_lhs and evaluate_rhs of our choice to perform an add. This is effectively a JIT[8]!
Of course, the “structured information” has its formal name: linker relocation records. But the name is not important. The important thing is as long as we parsed out those information, we can use them at runtime to emit executable code. And this process is extremely cheap: all it takes is a memcpy followed by a few scalar additions, thus the name “Copy-and-Patch”.
For example, the evaluate_add we just saw will produce an object file with the following contents:
Then, the following copy-and-patch logic would allow one to JIT this function at any address with any desired evaluate_lhs and evaluate_rhs targets:
1 2 3 4 5 6 7 8 9 10 11
voidcodegen(uint8_t* dst, uint8_t* lhsFn, uint8_t* rhsFn){ // The contents in the object file constexpruint8_t code[] = { 0x53, 0xe8, 0x00, 0x00, 0x00, 0x00, 0x89, 0xc3, 0xe8, 0x00, 0x00, 0x00, 0x00, 0x01, 0xd8, 0x5b, 0xc3 }; // The "copy" logic memcpy(dst, code, sizeof(code)); // The "patch" logic based on the relocation records *(uint32_t*)(dst + 2) = (uint32_t)(lhsFn - (dst + 2) - 4); *(uint32_t*)(dst + 9) = (uint32_t)(rhsFn - (dst + 9) - 4); }
Yes, that’s all of the core trick of Copy-and-Patch: at build time, compile the logic pieces we want to JIT into object file, and parse the object file to obtain the unrelocated code and relocation records (a stencil in the paper’s terminology). At runtime, code generation is simply wiring up the stencils and materializing them into executable code by a copy (memcpy) and a few patches (scalar additions).
Continuation-Passing Style = Branch
The generated code above works, but the code quality is miserable. Everything is executed by a call to another function, which is a lot of overhead.
voidcontinuation(int result); voidevaluate_add(int lhs, int rhs){ int result = lhs + rhs; [[clang::musttail]] return continuation(result); }
Now, the calls are gone. Furthermore, the function will end with a jmp instruction to function continuation (since the call is a tail call). Since we have control over where to put each function at, if we put continuation right after evaluate_add, then we can even eliminate the jmp to a fallthrough altogether[9].
After employing this trick, it’s fairly easy to prove that the generated code will not contain unnecessary jmp instructions: all the branches must correspond to actual control flow edges in the generated logic.
One of the main reasons that interpreters are slow is the unpredictable indirect dispatch. At this stage, our generated code has no indirect dispatch, in fact, no unnecessary branches at all. This is already a big speedup over an interpreter.
Address of External Symbol = Runtime Constant
Another important reason that JITs are faster than interpreters is the ability of JIT to burn runtime constants (bytecode operands, etc) into the instruction stream. Can we support it as well?
Of course! The trick is simple:
1 2 3 4 5 6 7
externchar x; // define an external variable voidcontinuation(uint64_t value) voidpointer_dereference_at_fixed_offset(void* ptr){ // "(uint64_t)&x" is the important part uint64_t result = *(uint64_t*)((uint64_t)ptr + (uint64_t)&x); [[clang::musttail]] return continuation(result); }
All it takes is to define an external symbol, and use its address as the runtime constant we want to use. Since by definition an external symbol is external, the compiler cannot assume anything about where it resides at[10]. This gives us a way to represent an opaque constant value.
Of course, the linker knows how to patch the code to make the external symbol point to the right location. Thus, we can patch it at runtime to make it represent any runtime constant as well :)
Finally, there are two most important codegen-level optimizations: register allocation and instruction selection[11]. Can we support them as well? The answer is yes. However, these optimizations are primarily only useful for the static language use cases where each bytecode only implements very simple logic[12]. So to keep this post focused, I will not go into details.
Copy-and-Patch: Wrapping up
I wouldn’t mind at all if you view Copy-and-Patch as a big hack: because it is! But it works! And it works nicely!
As shown in the paper, one can use Copy-and-Patch to construct extremely fast baseline JIT that significantly outperforms the existing state-of-the-arts:
For SQL database, we implemented a prototype SQL query baseline JIT that on TPC-H queries, compiles >1000x faster than LLVM -O3, while only generating 24% slower code.
Furthermore, Copy-and-Patch perfectly suits Deegen’s needs for a JIT:
It does not know or care about what is being JIT’ed. The logic we want to JIT is directly compiled by a C++ compiler into an object file at build time. C&P merely parses the object file to produce the stencils, which can then be used to JIT code at runtime.
The code generation at runtime is extremely fast, which perfectly matches the requirement of a baseline JIT. Note that we are doing a lot of expensive preprocessing work, but all of them happen at build time.
Deegen: the Art of Repurposing Existing Tools, Continued
While Copy-and-Patch is a nice technique, its vanilla form as described above is still not enough to fulfill Deegen’s use case. Specifically, the vanilla Copy-and-Patch still requires quite a bit of manual work to implement the stencils and the runtime logic, whereas in Deegen, all must be fully automatic.
As it turns out, fully automating Copy-and-Patch requires significant design-level improvements to the original technique, which we will cover in this section.
To make things easier to understand, we will use the following hypothetical Add bytecode as example (see prior post for a detailed explanation of the code):
To get good performance, it is almost mandetory for a JIT to be able to burn runtime constants (bytecode operands, etc.) into the instruction flow. In vanilla Copy-and-Patch, the programmer is required to declare the runtime constants by special macros. So our first improvement is to make this step automatic.
Fortunately this is fairly easy. In our case, the runtime constants are the bytecode operands, and for the IC, everything in the IC state. Since Deegen is already responsible for generating the bytecode decoding logic and the encoding / decoding of the IC state, all we need to do is to not emit the decoding logic, but a magic function call, so that the later processing stages knows that the value is a runtime constant.
For example, for Add, we know that the bytecode slot ordinal of lhs, rhs and the output slot are runtime constants. So the bytecode semantic function will be lowered to LLVM IR that conceptually resembles the following C logic:
1 2 3 4 5 6 7 8 9 10 11 12 13
size_t lhs_slot = __runtime_constant_lhs_slot(); size_t rhs_slot = __runtime_constant_rhs_slot(); TValue lhs = stack[lhs_slot]; TValue rhs = stack[rhs_slot]; if (!lhs.Is<tDouble>() || !rhs.Is<tDouble>()) { ThrowError("Can't add!"); } else { double res = lhs.As<tDouble>() + rhs.As<tDouble>(); // Lowered from the Return() API size_t output_slot = __runtime_constant_output_slot(); stack[output_slot] = TValue::Create<tDouble>(res); __dispatch_to_next_bytecode(); }
Correspondingly, at runtime, in order for the generated JIT to generate code, it needs to decode the bytecode struct to retrieve all the operand values and use these values to materialize the copy-and-patch stencils: we will showcase the concrete generated implementation of the __codegen_Add function (which emits machine code for Add at runtime) later in the post.
Propagating the Runtime Constants
Acute readers may have noticed that the C logic above cannot result in optimal code. Consider line 3: TValue lhs = stack[lhs_slot]. What actually happens in this line is that we are decoding address (uint64_t)stack + lhs_slot * 8 (since each TValue is 8 bytes). If we only make lhs_slot a runtime constant (as we are doing right now), there is no way for LLVM to fold lhs_slot * 8 into a constant (recall that at LLVM level, a runtime constant is really the address of an external symbol). As a result, it will generate less-optimal code like mov $XXXX, %rax; shl 3, %rax.
Therefore, we need a customized LLVM constant propagation pass to identify all the constant expressions derived from the “root” runtime constants. Then, we should make each constant expression a runtime constant. Of course, this also means that at runtime, in order to populate these derived runtime constants with concrete values, the codegen function needs to replay the computation of the expression using the concrete values of the root runtime constants.
After this transform, the LLVM IR of our Add example would resemble the following C logic:
As we already explained, in Copy-and-Patch, a runtime constant is expressed by the address of an external symbol.
While it is a neat trick that is crucial for high-quality code, it could break down and cause miscompilation in edge cases. For example, consider the code below:
1 2 3 4 5 6 7
externchar x; voidf(){ uint64_t val = (uint64_t)&x; if (val == 0) { /* do something */ } }
LLVM would deduce that the val == 0 check is trivially false, and “optimize away” the whole if-clause. Why? Because val is the address of variable x, and of course the address of a variable is never 0, good game.
In vanilla Copy-and-Patch, the programmer is responsible for avoiding such corner cases. But in Deegen, where stencils are automatically generated, we must find a systematic and provably-correct solution.
So what’s the issue? You might think the issue is “symbol must not be null”. That’s what I initially believed as well[13], but I later realized it is only the symptom of a much larger issue.
As it turns out, according to x86-64 ABI, every symbol will reside in address range [1, 2^31 - 2^24)[14]. This is also exactly the assumption held by LLVM, and used by LLVM to do optimizations (e.g., in the example above, it deduces that the address of a symbol must not equal 0). So the “val == 0 check” example is not the only buggy case. LLVM can, for example, do a zero extension instead of a sign extension, as it believes that the address of the symbol must have bit 31 being 0 thus a ZExt is equivalent to a SExt, causing buggy code if the runtime constant were to represent a negative value.
One might think the [1, 2^31 - 2^24) range assumption is artificial, but it isn’t. This range assumption is actually important to generate correct code. For a simple example, the code movq sym+100(%rax), %rax would not work correctly due to an int32_t overflow in the imm32 addressing mode field of the instruction, if sym were to have value 2^31 - 50.
Therefore, for a provably correct solution, we must make sure that whenever we use an external symbol to represent a runtime constant, the runtime constant we want to express must fit in [1, 2^31 - 2^24).
In Deegen, this is accomplished by a customized Constant Range Analysis pass to track the range of every constant expression based on the runtime constants. Of course, we also need to know the possible range for the “root” runtime constants – the bytecode operands, and the values captured by the IC state. Fortunately, for most of them, the range is implicit (for example, a bytecode slot is known to be a small non-negative integer, and an operand with type uint16_t obviously fits in [0, 65535]) and requires no user intervention. For the rest, a new Deegen API is added so the user can tell us the range assumption of the value.
Once we figured out the proven range of each runtime constant expression, we can retrofit it into our target range [1, 2^31 - 2^24) by simple transformation. To explain how it works, let’s revisit our Add example:
lhs_slot is a root runtime constant. Since it represents a bytecode slot ordinal, it is known to be a small non-negative integer, say [0, 10000].
And we have a derived runtime constant lhs_slot * 8, which is known to fit in [0, 80000] by range analysis.
The range [0, 80000] does not fit in [1, 2^31 - 2^24).
However, if we define a new expression new_expr := lhs_slot * 8 + 1, the new expression would have range [1, 80001] and fit the assumption.
Therefore, we use an external symbol sym to represent lhs_slot * 8 + 1, and rewrite the LLVM IR to substitute lhs * 8 with sym - 1.
Now, we are guaranteed correct code as the symbol range assumption is met.
Lastly, if the range of an expression is too large to fit in [1, 2^31 - 2^24), we simply give up. This means the expression will be evaluated at runtime, but this is rare, and is only a minor performance issue, not a correctness issue.
After this transformation, the conceptual logic of the Add example would look like something below:
Note that in normal cases, those +1 / -1 adjustments will not end up as machine instructions in the resulting JIT code, as normally all of those computation ends up being an imm32 field of an instruction, as we’ll see in the example below.
Example: Generated Code for the AddVV Bytecode
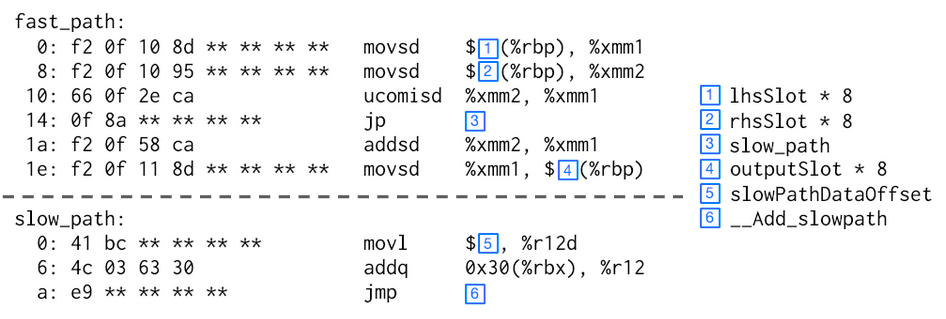
For a concrete example, the figure below demonstrates the disassembly of the actual JIT code generated for the Lua AddVV bytecode, which performs a Lua add on the given two bytecode values. The C++ bytecode semantic that Deegen takes as input is here.
The blue boxes indicates the runtime constants that gets burnt into the instruction stream, with their value definitions shown on the right.
Note that the code contains two separated parts: fast_path and slow_path. We will explain this in detail in the next section: for now focus on fast_path only.
As one can see, the code quality has no problem rivalling a hand-written baseline JIT. It loads the two operands from the stack frame, and checks if any of them is NaN, which means either double NaN or a non-double value (which will exhibit as NaN in our NaN-boxing scheme). If so, it branches to slow_path. Otherwise, it performs a double addition and stores the result back to the output_slot in the stack frame. Finally, the control implicitly fallthroughs to the next bytecode.
The implementation of the JIT compiler logic that generates the above code at runtime will be showcased in the next section.
Design of the Baseline JIT
Having covered the core of the JIT code generation system, we are finally ready to explore the design of the JIT itself and the supporting components.
For a quick overview, the following figure illustrates the high-level architecture of the baseline JIT (except inline caching, which is complex enough that deserves its own section):
The AOT Slow Path
A distinctive “feature” of dynamic languages is the pervasive existence of slow paths. For example, if you call a boolean value like true (why would anyone do that?), it could trigger some complicated metamethod lookup in Lua, ending up with a function to call or an error. In Deegen, a slow path can be created by both automatic type-based quickening and explicit user annotation (the EnterSlowPath API). But for the JIT, there are some extra complexity in implementing them.
Obviously, the slow path logic should be AOT-compiled, not JIT’ed. However, this introduces two problems:
How the JIT’ed code could transfer control to the AOT slow path.
How the AOT slow path could transfer control back to the JIT’ed code.
Let’s look at the second problem first. The bytecode stream does not contain any information about the JIT’ed code. Also, the slow path could make branches to other bytecodes and calls to other functions, so it’s not as easy as letting the JIT’ed code pass the JIT address of the next bytecode to the slow path.
Deegen’s solution is a dedicated SlowPathData stream. The SlowPathData stream is similar to the bytecode stream, except that it is intended to be used by the AOT slow path of the JIT tier, instead of the interpreter. A SlowPathData contains all the information needed by the slow path, such as bytecode operands, JIT address for this bytecode, JIT address of the conditional branch target of this bytecode, etc. When the JIT’ed code wants to transfer control to the slow path, it would pass the SlowPathData pointer corresponding to the current bytecode to the AOT slow path. The AOT slow path can then have access to all the data it needs to complete the execution and transfer control back to JIT’ed code.
Of course, the SlowPathData stream has to be generated. Fortunately, since Deegen understands the bytecode stream, it is not hard to generate logic that transcribes the bytecode stream to the SlowPathData stream. Specifically, the generated JIT compiler will generate the SlowPathData stream alongside the executable code.
Now let’s look at the first problem. Transferring control from JIT’ed code to the AOT slow path requires some set up logic, for example, to correctly set up the SlowPathData pointer. However, these logic are rarely executed, as slow paths are, of course, rarely used. If no special handling is taken, the resulted code would have cold logic and hot logic mixed together, resulting in unnecessary additional branches and worse code locality. Of course, this is not a correctness problem, but ideally we want to handle it without sacrificing compilation time.
Deegen employs the solution used in JavaScriptCore: hot-cold code splitting, except that Deegen must accomplish it automatically. Specifically, every stencil will be split into a hot part and a cold part. The JIT will generate two streams of executable code, one holding all the hot path logic, and one holding all the slow path logic. The hot-cold splitting is accomplished by an ASM transformation pass, which we will elaborate in the next section.
The Baseline JIT Algorithm
We now have all the pretexts to understand how the baseline JIT itself works.
In addition to the logic that actually generates machine code, Deegen also generates a bytecode trait table that contains various info about the generated code for each bytecode, e.g., the length of the JIT’ed code’s hot part and cold part, the length and alignment of the data section accompanying the JIT’ed code, the length of the SlowPathData for this bytecode, etc. This allows the baseline JIT to precompute all the buffer sizes in advance.
The baseline JIT compiler works in two passes.
In the first pass, we iterates through the bytecode stream, and use the bytecode trait table to compute various buffer sizes of the generated code and data. All the buffers are then allocated in advance, knowing that a buffer overrun will never happen when we actually fill contents (code, data, etc.) into the buffers. This pass is very cheap because no indirect dispatch is needed.
In the second pass, we iterates through the bytecode stream again, and generate everything (executable code, the accompanying data, the SlowPathData, etc.) for each bytecode by populating the pre-allocated buffers. This step conceptually works similar to an interpreter. We have a pre-built dispatch table storing the codegen functions for each bytecode kind. Control is first transferred to the codegen function for the first bytecode. The function would generate everything needed for the first bytecode, advance buffer pointers accordingly, and then transfer control to the codegen function for the next bytecode. This process repeats until the end of the bytecode stream is reached.
Thanks to Copy-and-Patch, each codegen function is completely branchless, except the tail dispatch that transfers control to the next codegen function, as we shall see in the Add example below. This allows a modern CPU to utilize its Instruction-Level Paralleism (ILP) capabilities to the utmost, yielding an extremely fast compilation process.
Finally, due to the nature of one-pass code generation, bytecodes that can branch to other bytecodes would not know their branch destination address at the time their own code is being generated. To solve this issue, those bytecodes would push information about how the branch destination address shall be fixed up into a late-patch buffer. After all code generation is done, we need to iterate through the late-patch buffer and fix up all the branch targets.
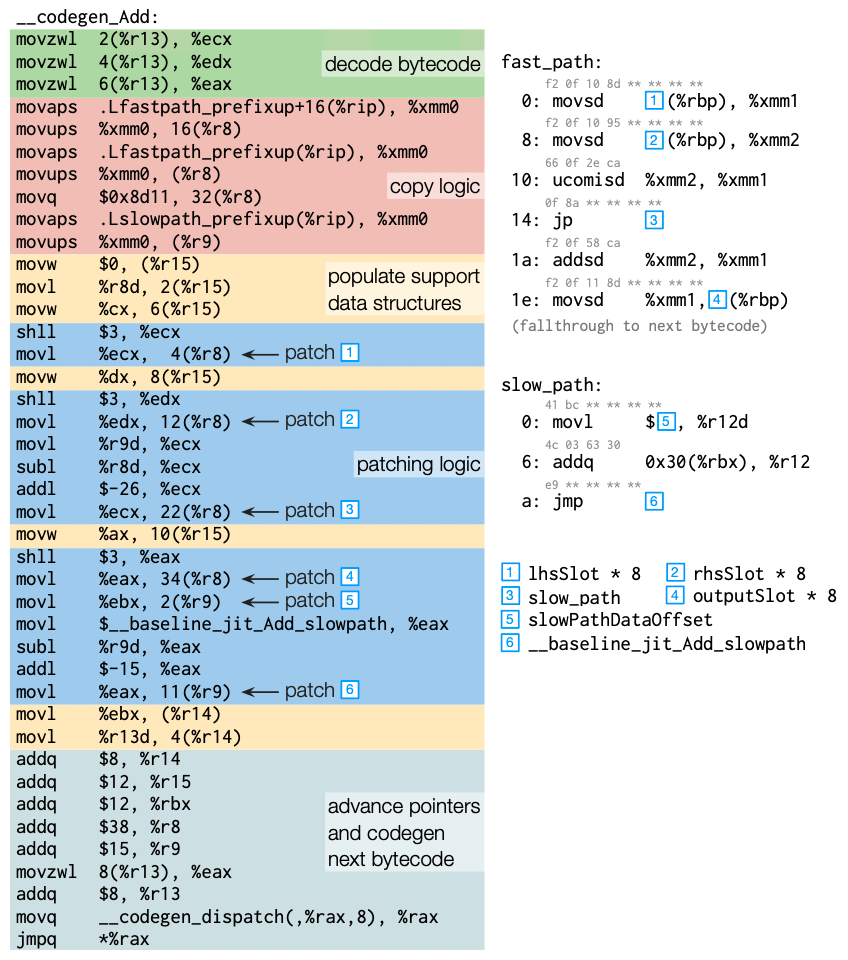
Example: Code Generation Function for the AddVV Bytecode
Below is the actual code-generation logic generated by Deegen that generates code for the Lua AddVV bytecode. The machine code generated by the logic is demonstrated in the right half of the figure for cross-reference.
As one can see, the code-generation logic is just what we have explained in the previous subsection. It first decodes the bytecode, then performs a copy-and-patch to generate the JIT fast path and the JIT slow path logic. The expression that defines each runtime constant is replayed to compute the patch value in the instruction stream. Besides the machine code, it also generates the SlowPathData stream and other minor support data. Finally, it advances pointers and dispatch to the next codegen function to codegen the next bytecode. The whole process is completely branchless (except the tail dispatch) by design.
Supporting Inline Caching: the Art of Repurposing Existing Tools, Evermore
Due to inherent design constraints of a baseline JIT (e.g., compilation must be fast, no OSR-exit is allowed), inline caching (IC) is the only high-level optimization tool available to the baseline JIT.
And inline caching is powerful: on benchmarks that extensively work with Lua tables, a baseline JIT with IC can often be more than 100% faster than the same baseline JIT without IC[15].
In this section, we will elaborate how Deegen supports inline caching.
How IC works in Deegen: a Step-by-Step Example of Call IC
For a beginner’s introduction to what IC is, please read the background section. However, to understand how IC actually works in Deegen’s baseline JIT, the easiest way is to walk through an assembly example. Here, we will use a simplified Call bytecode, which performs a call with no arguments and discards all return values, to demonstrate how call IC works.
The C++ bytecode semantic description is very simple:
It checks if the callee is a function object. If so, it uses Deegen’s MakeInPlaceCall API to make a call, and the return continuation simply discards all return values and transfer control to the next bytecode. Otherwise, it enters the outlined slow path function (omitted) that checks for a metatable call.
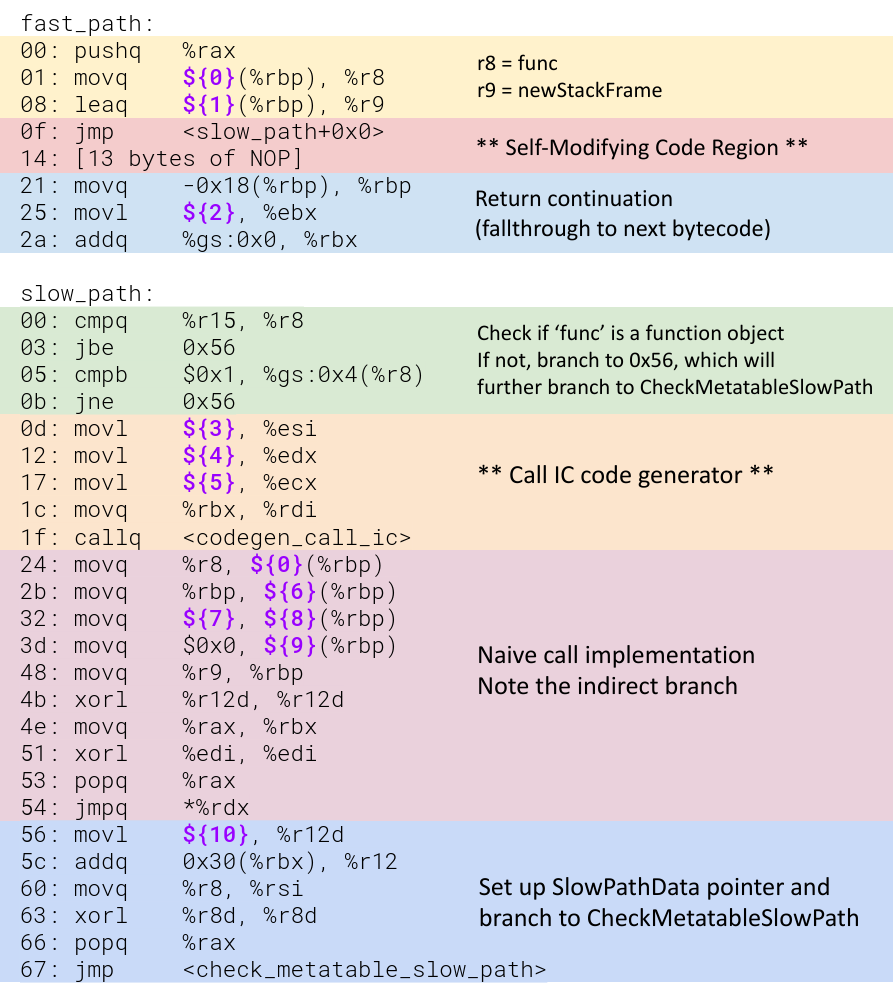
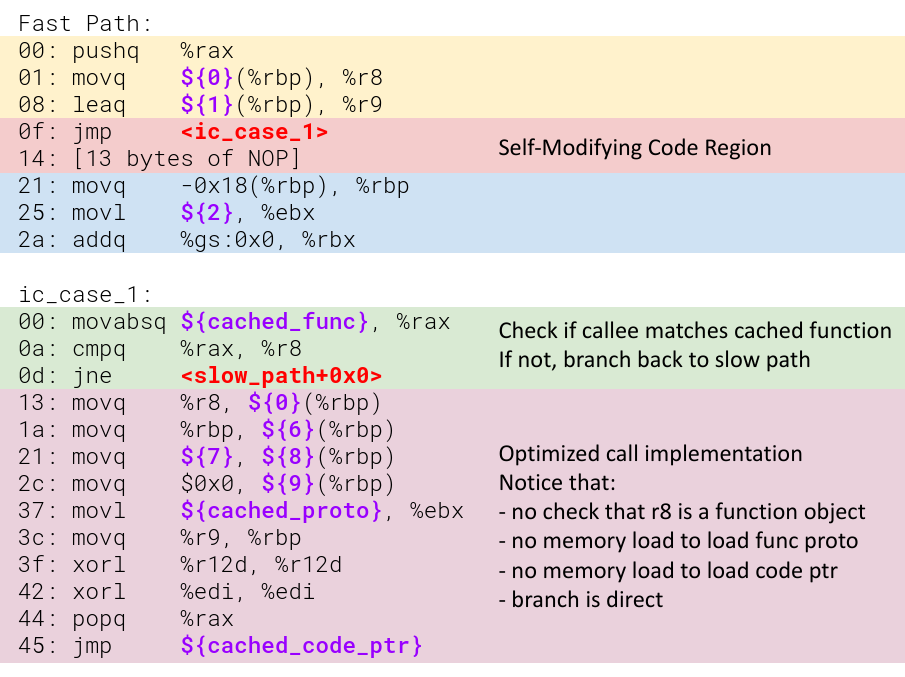
Deegen would generate the following JIT code for this bytecode:
Note that runtime constants are marked in purple in the form of ${X}.
Let’s pretend for now that the codegen_call_ic thing doesn’t exist, and look at the naive implementation. If you stare at the assembly code a little bit, you will notice that the logic involves:
Two branches to check that func is a function object.
Two dependent memory loads: one loads the function prototype proto from func, and one loads the actual entry point address from proto.
One indirect branch to branch to the entry point.
Unfortunately, dependent memory loads and unpredictable indirect branchs are exactly the two things modern CPUs hate the most. Even predictable branches can be slow, if there are too many of them so that the BTB is overwhelmed.
So how does IC speeds up this code?
As one might have expected, codegen_call_ic will be called on the first time this code is executed. What codegen_call_ic does is that it will emit a piece of IC code snippet, and chain it to the main logic by repatching the self-modifying-code (SMC) region, as shown below:
As one can see, the next time the same function is called, thanks to the SMC region, the IC will hit, and the optimized logic will be executed. The optimized logic does not check that func is a function object (because we already checked it last time), has no memory loads, and the branch is direct.
This process can be repeated to chain any number of IC entries into a chain:
SMC region branches to IC #N
IC #N branches to IC #(N-1) if the cached value does not hit
… etc …
IC #1 branches to the IC miss slow path, which will create a new IC snippet #(N+1) and chain it at the head of the chain.
Of course, at a certain point the overhead from the check chain would cancel out the benefit of the optimized code, and we will stop chaining more cases.
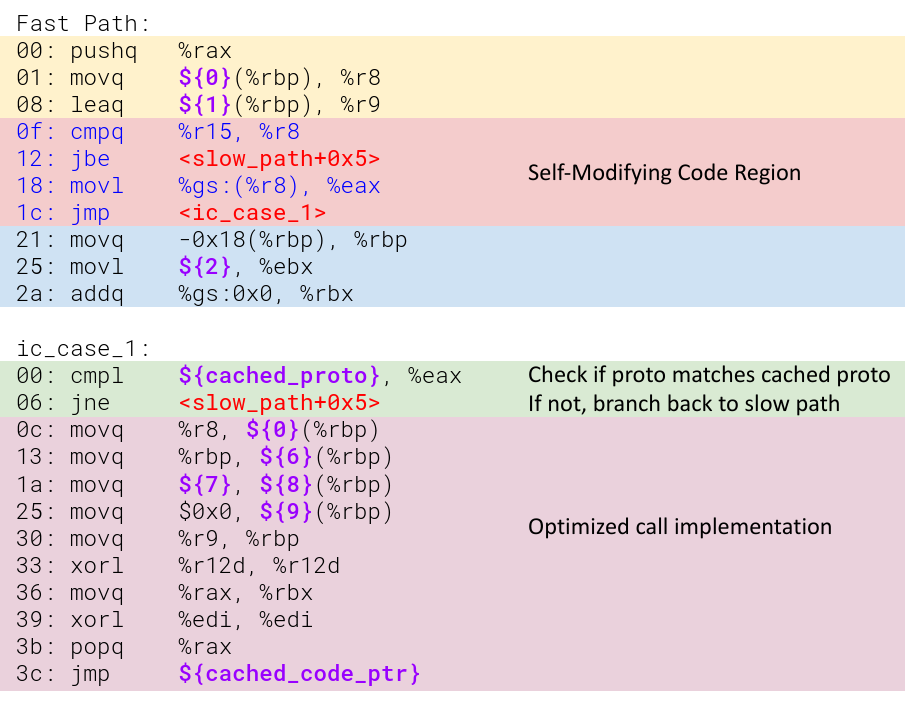
Call IC’s Direct Call Mode vs Closure Call Mode
While the above approach works well if a Lua function is used like a C function (monomorphism) or a C++ virtual method (class-like polymorphism), it would work very poorly for the function factory design pattern. For example, consider the following Lua snippet:
1 2 3 4 5 6 7 8 9 10
createCounter = function() local value = 0 returnfunction() value = value + 1 return value end end incrementCounter = function(counter) return counter() end
In this example, the call in line 9 is likely to see a lot of different function objects, even though all of them share the same prototype (the counter lambda in line 3). Since our current call IC strategy caches on the function object, not the function prototype, it is completely ineffective for this use pattern.
Again, we employ the solution used in JavaScriptCore. Our call IC supports two modes: direct call mode and closure call mode. A call IC site always starts in direct call mode, in which it caches on function objects, as we have shown above.
But when a call IC site first sees a IC miss that has the same function prototype as one of the already-cached function objects, it will transition the IC to closure-call mode. To do this, it rewrites the self-modifying code region and invalidates all existing ICs at this site, and from now on, this IC site will instead cache on the function prototypes. This is demonstrated by the figure below:
As one can see, the SMC region is repatched to completely different logic: it checks if func is a heap object (which is required for us to load its hidden class), then load the hidden class of the heap object and branch to the first IC case.
Each closure call IC case caches on a function prototype. So it compares if the hidden class matches the cached prototype. If yes, it knows that func must be a function object with the cached prototype, so it can perform an optimized call similar to before.
Of course, one can also chain up as many IC cases in closure call as desired, until the chained check overhead overwhelms the perf gain from the optimized code.
As one can see, closure call mode is less efficient than direct call mode as it performs one extra check and one extra memory load, but it works effectively for the function factory design pattern. This is why a call IC site always starts in direct call mode, and only transitions to closure call mode when it actually observes a closure call pattern.
So, How to Automatically Generate All of These?
Having understood how IC works in Deegen (we only demonstrated Call IC, but the case for Deegen’s Generic IC API is similar), the next question is: how could Deegen generate all of these automatically?
However, as you can already see, what we want to do is something totally outside the operating envelope of LLVM. LLVM is simply not designed to generate a function that can dynamically patch itself at runtime to append a dynamic chain of parametrizable code snippets.
As before, our solution is to repurpose existing tools to trick LLVM into helping us without its knowledge. And as it turns out, the core of the trick is to repurpose a completely-irrelevant little-known GCC feature in the dark corner.
Thank you, GCC ASM-goto!
GCC supports a little-known extension feature called ASM-goto, which basically allows one to write inline assembly that branches from assembler code to C labels. And LLVM, aiming for compatibility with GCC, has also supported this feature a few years ago by a special CallBr IR instruction.
I just want to say a big thank you to the GCC developers who designed this feature and the LLVM developers who added support for it! Without this feature, it’s very likely Deegen couldn’t support inline caching at all.
So how does ASM-goto have anything to do with inline caching?
As you might have seen from the assembly example above, the hard part of IC is that each IC case is a piece of machine code that directly “clings” to the main logic. It cannot be implemented by a separate function due to the call overhead and the requirements of Lua’s stackful coroutine. It must work directly using the context (e.g., which register holds which value) of the main logic, and could transfer control to different destinations in the main logic.
ASM-goto (and its underlying CallBr LLVM IR) provided exactly the semantics we want. Since it is an InlineAsm, LLVM is required to treat its contents as opaque. All LLVM knows is that after executing the InlineAsm, control will be transferred to one of the destinations specified in the CallBr.
In other words, we repurpose CallBr as a way to model “a control flow transfer in an unspecified manner”. At runtime, we are building up a dynamic chain of IC cases; but if one views the chain-check logic as a black box, then it can be characterized as: after the black box is executed, control is transferred to either an IC hit case specialized to the cached values, or the IC miss slowpath. This is exactly the semantics CallBr provided, so we can safely model it using CallBr.
But this is still far from enough. Now we have a way to model the control flow of the dynamic IC chain in LLVM IR, but it’s still unclear how we can extract the IC logic from the main function, implement the IC check chain, and do all the self-modifying code stuff.
This is where the last piece of the puzzle comes in: ASM transformation.
ASM Transformation: the Last Piece of the Puzzle
I know this might scare off people, as directly messing with assembly sounds like an extremely fragile approach.
But it really isn’t. Deegen treats most of the assembly instructions as opaque and will not modify any of them. The ASM transformation is limited to reordering and extracting ASM blocks.
As a result, Deegen’s assembly knowledge is extremely limited. All it knows is that:
A jmp does a direct jump.
A jmpq does an indirect jump.
Any other instruction starting with j does a conditional jump.
However, as it turns out, with some clever tricks and cooperation from LLVM IR, doing only ASM block rearrangements is already sufficient to achieve a lot: we can support all the inline caching stuffs, among other things.
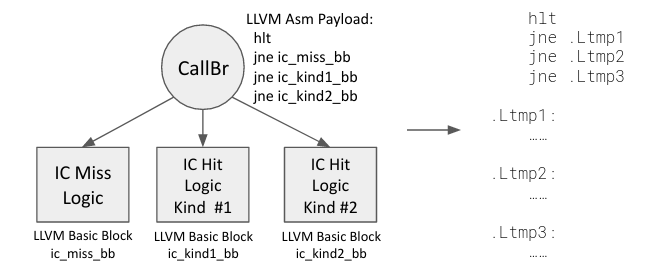
The full trick is the following. Recall that we are only using CallBr as a device to express an opaque control flow, and the InlineAsm inside CallBr does not matter. So we will use this InlineAsm to carry down information to the textual assembly level, as shown below.
As one can see, the previledged instruction hlt is used as a magic to allow us to identify the CallBr in the textual assembly. Then, the fake branches following the hlt allows us to know the assembly labels that implements each logic case.
Having parsed these information, we no longer need the CallBr payload, so we remove it from assembly, and make it branch to the slow path directly.
Next, we perform a CFG analysis of the assembly. The only hard part about the CFG analysis is to know the possible destinations of the indirect branches. This ideally should be implemented as a LLVM backend pass, but I haven’t figured out how to do it due to limited documentation about LLVM backend. So currently, the indirect branch target analysis is done via some hacks that map the indirect branch back to LLVM IR by debug info.
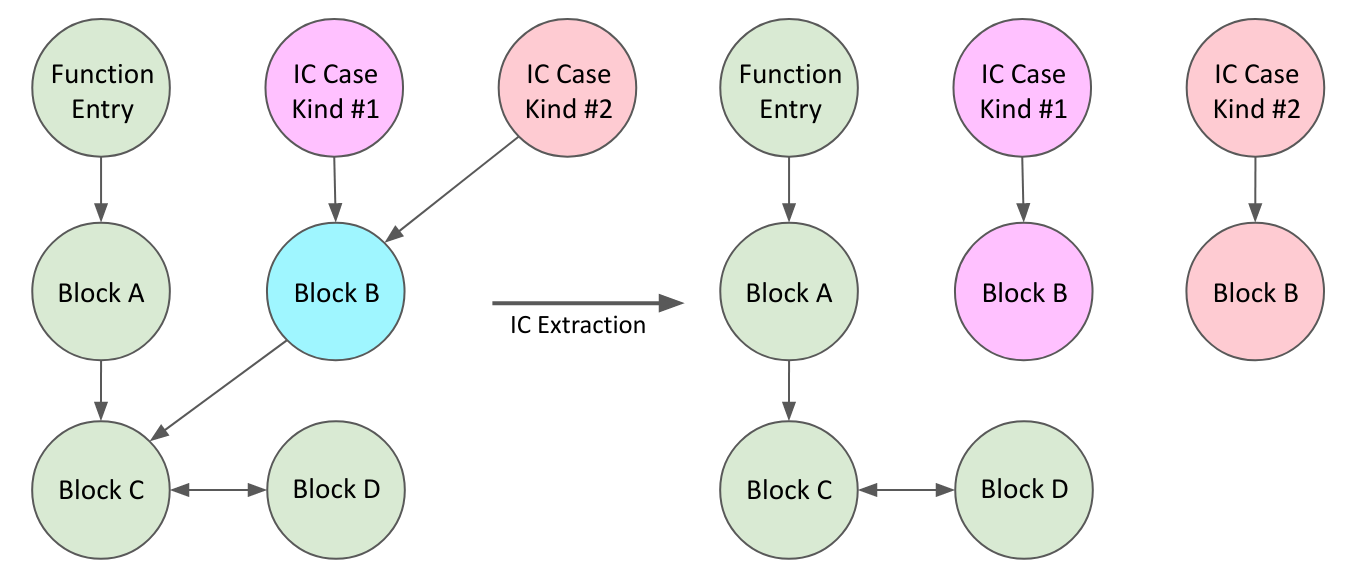
Now we have the CFG of the assembly, we can then figure out the ASM blocks only reachable from the function entry, and only reachable from each IC logic kind, as shown below.
Note that the logic entry of each IC kind must not be reachable from the function entry, because they are only reachable by the CallBr, but we have removed those control flow edges as the CallBr has been removed by us.
Finally, we can separate out the IC logic from the main function logic. For the main function, we only retain ASM blocks reachable from the function entry. And for each IC kind, we only retain ASM blocks reachable from its logic entry but not the main function entry. Each piece of extracted assembly is then compiled to object file and extracted to a Copy-and-Patch stencil, so we can JIT it at runtime.
There are still some minor issues that we haven’t covered, such as how we build up the dynamic IC check chain, and how exactly the self-modifying code region is constructed. But the idea is similar to how we supported inline caching: most of the heavy-lifting of actually building up the logic is done at LLVM, and InlineAsm is repurposed as a tool to pass down information to assembly. Then at assembly level, Deegen can piece everything together by very simple transformations that requires little to no assembly knowledge.
The Inline Slab Optimization
Deegen employed one additional optimization for IC: the Inline Slab optimization (again, the terminology is a JavaScriptCore jargon).
Conceptually, the idea is very simple: currently, each IC case is an outlined piece of JIT code. As a result, control has to branch from main logic to the IC case, and then from the IC case back to the main logic in the end. So why not use the SMC region to hold one IC case? Now, the “blessed” IC case sitting directly inside the SMC region can be executed directly, saving one or two jumps[16].
Of course, it is harder to do than said. One has to decide a good size for the inline slab (i.e., the SMC region), as only IC whose size is less than the inline slab size can sit in the inline slab. And updating the patchable jump in the SMC region is more complicated, as the location of the jump is different depending on whether the inline slab exists. Finally, the inline slab version of the IC has slightly different logic from the normal version: the tail branch could potentially be eliminated, and one must pad NOPs to exactly the size of the inline slab.
As a result, even in JavaScriptCore, the inline slab optimization requires quite some engineering efforts, e.g., more hand-rolled assembly, manual book-keeping of the inline slab sizes that has to be updated whenever the generated assembly changes, etc.
Fortunately, in Deegen, the inline slab optimization is employed fully automatically. So for a language implementer, the additional ~4% performance on average (and occasionally 10+% on IC intensive workloads) from inline slab comes for free!
Runtime Support, and IC Design Summary
Finally, the VM runtime needs to manage the IC. For example, it needs to reclaim the JIT code memory when the IC is invalidated, and upon tiering-up, it needs to update all the call IC cases to point to the new entry point.
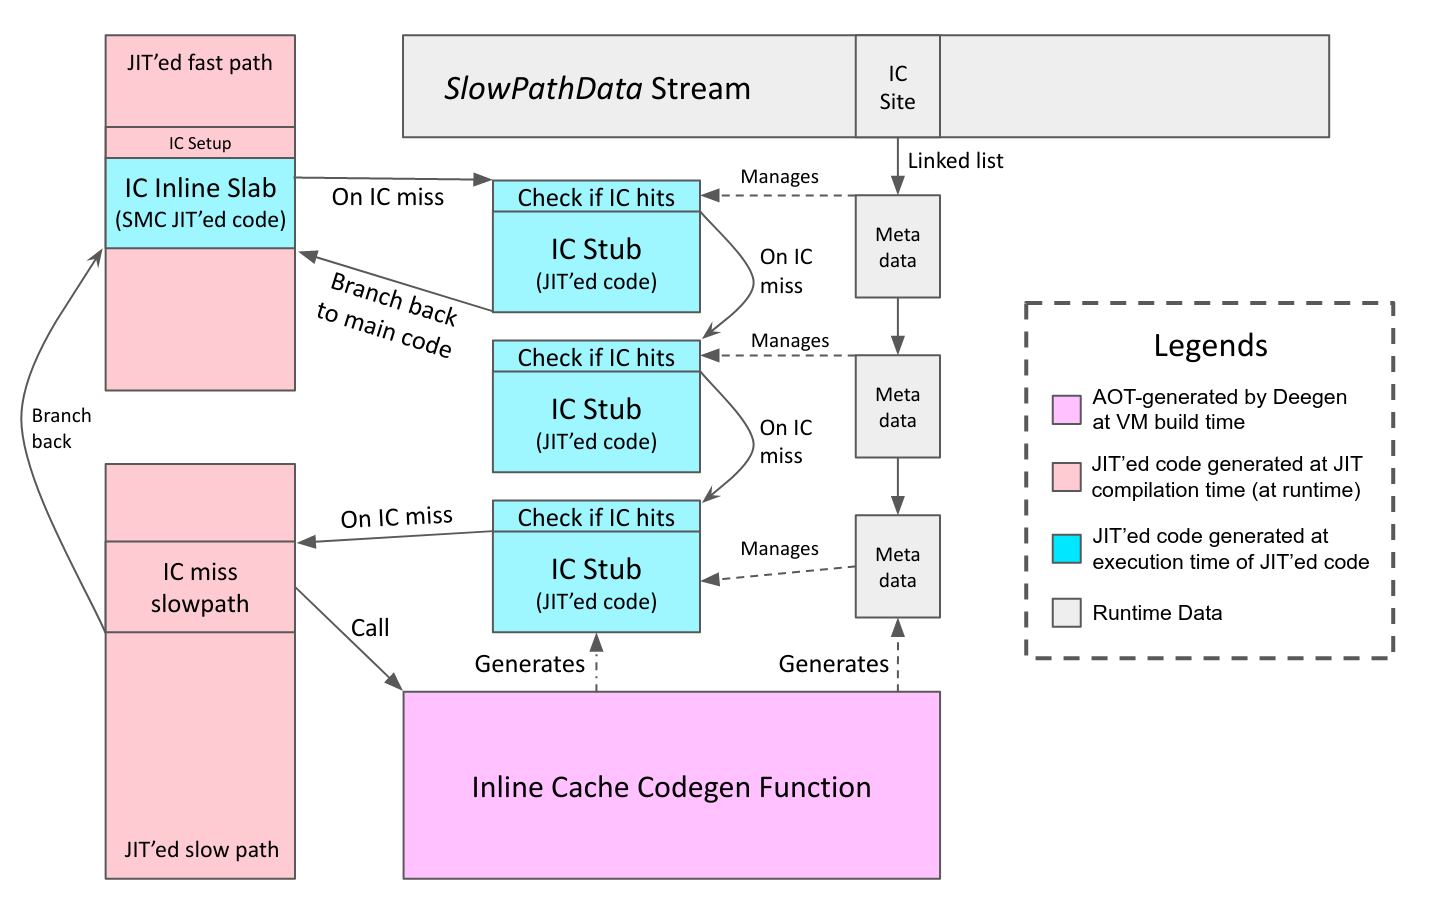
Therefore, in additional to the actual JIT’ed code, we also need to allocate a piece of metadata to manage each IC. The metadata are chained into a linked list at the use site of the IC (the ICSite), which resides in the SlowPathData stream.
Putting everything about Deegen’s IC design together into one figure:
Full Example for Deegen’s Generic IC: TableGetById Bytecode
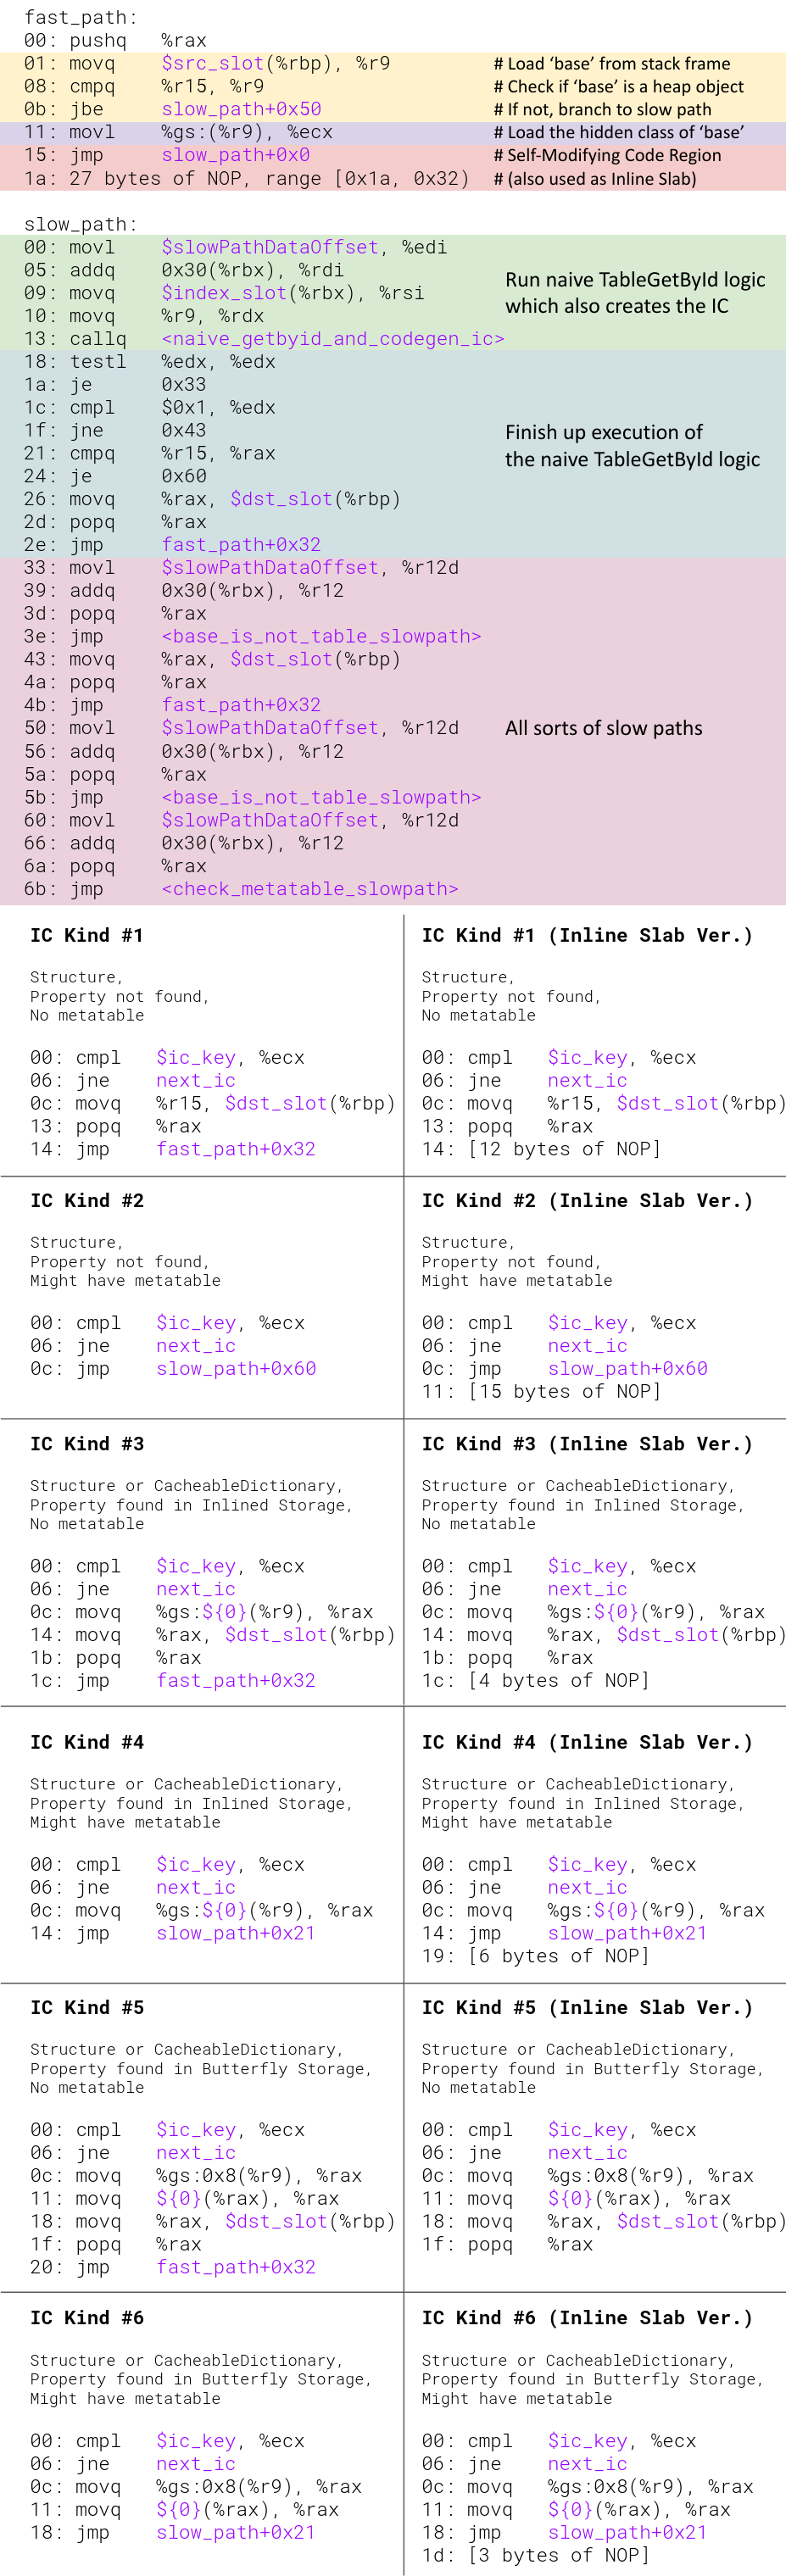
To conclude our discussions on inline caching, we will present a full example for the TableGetById (aka., TGETS in LuaJIT) bytecode.
The bytecode takes two operands: base and index, where index is a constant string, and returns base[index]. Any Lua string property access, for example, employee.name or animal.weight, would generate this bytecode.
In LuaJIT Remake, a Lua table is not implemented by a plain hash table with an array part, but employs hidden class for better performance, using a design mostly mirroring JavaScriptCore’s. Deegen supports generic IC API to allow easy deployment of IC via clever use of C++ lambdas. The actual implementation of the C++ bytecode semantic for TableGetById can be found here.
The figure below is the disassembly of the actual machine code generated by the baseline JIT, alongside the JIT’ed code for all 6 kinds of IC stubs, as well as their inline-slab versions. As before, the runtime constants burnt into the instruction stream are shown in purple text.
As you can see above, in the good case of an inline-slab IC hit for a table without metatable (which is very common), a TableGetById can be accomplished with no taken branches and in less than 10 instructions. This is why IC could drastically speed up table operations.
On the other hand, as you can also see above, implementing IC by hand requires a deep understanding of assembly and a significant amount of engineering. This is exactly where Deegen comes in. With Deegen’s generic IC API that makes all of these happen automatically, a language implementer can enjoy the benefits of IC without the high engineering cost.
The Hot-Cold Splitting Pass and Jump-to-Fallthrough Pass
Finally, since we already have an ASM transformation infrastructure, why not use it for more good?
The Hot-Cold Splitting Pass works by reordering ASM blocks and move cold blocks to a separated text section, which reduces some unnecessary branches and improves code locality. Of course, the stencil extraction logic that generates the copy-and-patch stencil from the object file needs to be made aware of this and extract both sections, but this is not hard to do. To figure out which blocks are cold, ideally, one should write a LLVM backend pass. However, as explained before, I still haven’t figured out how to write a LLVM backend pass, so currently this is accomplished by injecting debug info to map assembly blocks back to LLVM IR blocks, and use LLVM IR’s block frequency infrastructure to determine the cold blocks.
The Jump-to-Fallthrough transformation pass attempts to move the dispatch to the next bytecode to the last instruction, so that the jump could be eliminated to a fallthrough, reducing an unnecessary branch. This is needed because at LLVM IR level, a dispatch is a tail call, and LLVM is not aware of the fact that a dispatch to the next bytecode could potentially[17] be implemented by a fallthrough if it were the last instruction. Deegen implemented a simple pass to address this issue, which attempts to make the fallthrough possible by reordering ASM blocks and doing very limited rewrites like flipping branch conditions.
An End-to-End Example
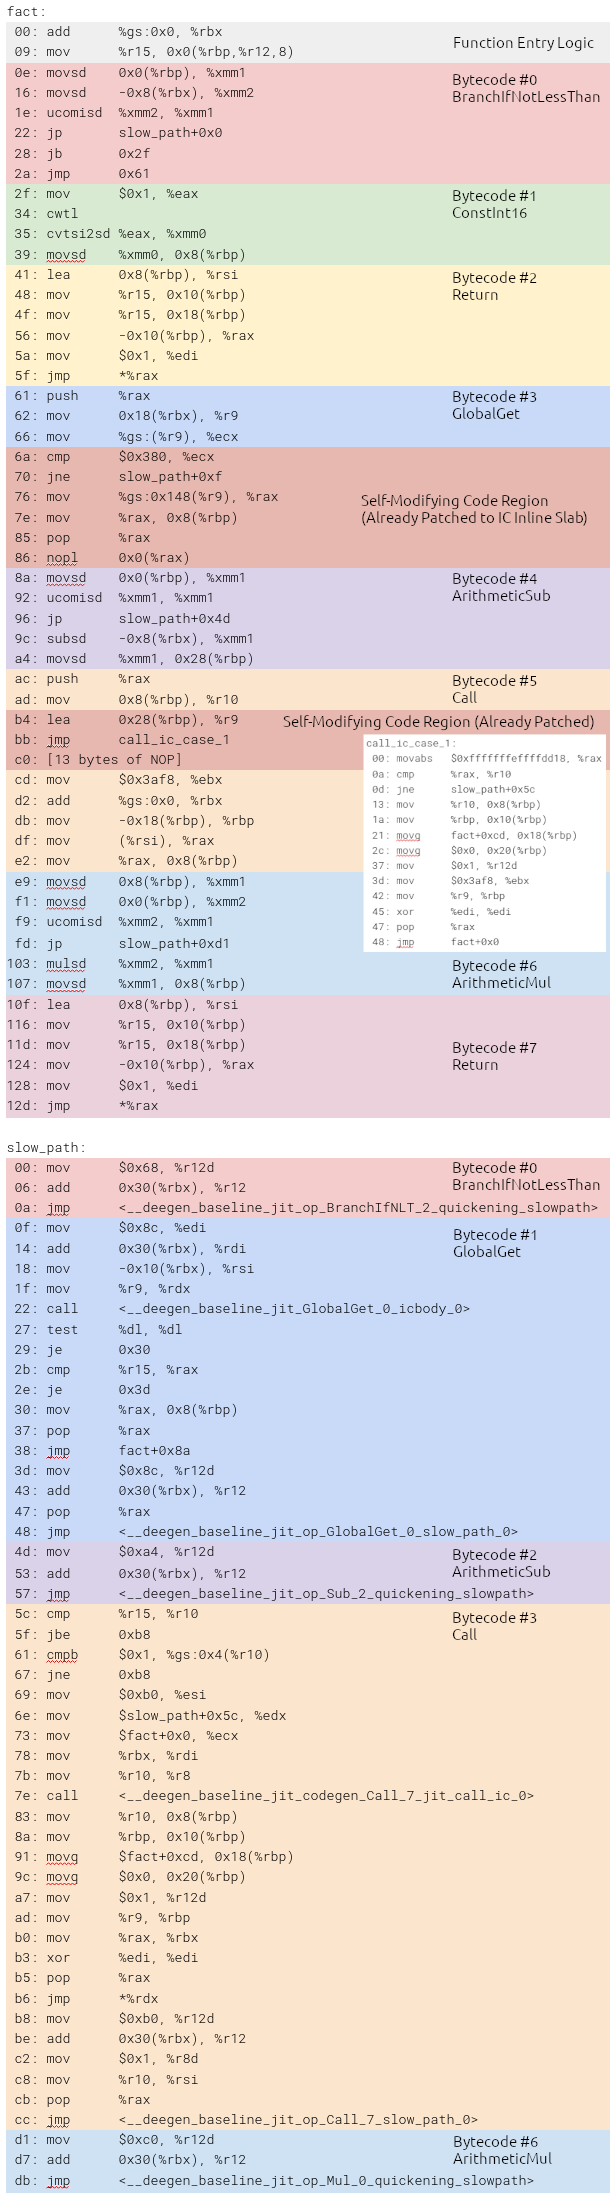
To demonstrate how the actual end-to-end JIT’ed code generated by the baseline JIT looks like, we will use the following Lua example that computes a factorial:
1 2 3 4 5 6 7 8 9
-- Intentionally written without 'local' so that 'fact' -- is a global variable lookup, to demonstrate the JIT -- code generated from Deegen's generic inline caching API fact = function(n) if (n < 1) then return1 end return fact(n-1) * n end
While it is a simple example, it demonstrates almost all the important things in a baseline JIT: basic operations such as arithmetic and comparison, control flow, function calls, call inline caching (automatically provided as part of Deegen) and table inline caching (implement using Deegen’s generic IC API).
For clarity, we demonstrate the code after the function has been executed, so all the self-modifying code regions (including inline slabs) have been repatched, and outlined IC stubs have been created.
I manually grabbed the JIT’ed code using GDB and hand-remapped all the labels, so please pardon me if I made an mistake. The disassembly is as follows:
Note that under normal circumstances (i.e., a number is passed in as parameter to fact), the GlobalGet and Call slow path will be executed once to create the IC. After that, none of the slow path logic will ever be executed, and none of the self-modifying code region in the fast path will get repatched further.
Tiering-up Logic
The last bit of complexity is the tiering-up logic. In a multi-tier VM, the user program starts execution in the interpreter tier, and hot functions are eventually tiered up to the baseline JIT tier (and potentially further to the optimizing JIT tier, but that’s future work).
To support tiering-up, we have two problems to solve. First, how hot functions could be identified. Second, how future calls to the tiered-up function could get redirected to the JIT’ed version.
Let’s look at the second problem first. While seemingly trivial (just change the entry point stored in the function prototype), it is actually not that trivial due to the existence of call IC. When a function gets tiered-up, every call IC that caches on the function must be updated and redirected to the new entry point. To achieve this, all the call IC are chained into a circular doubly-linked list on the function prototype that it caches on. In addition, Deegen generates information on how one can update the JIT’ed code of a call IC to change the function entry point it branches to. Then, whenever a function is tiered up, one can iterate through all the call ICs caching on the function using the doubly-linked list, and update each of them to point to the new entry.
For the first problem, the idea is to increment a per-function counter whenever the interpreter reaches a loop bytecode or a function return bytecode. When the counter reaches a threshold, we trigger JIT compilation and redirect control to the JIT’ed code. Unfortunately, the engineering of this part has not been finished. I have to publish this post now, because this post is used as the reading material for a talk a couple of days later :(
This also means that currently we cannot tier-up from interpreter to baseline JIT, so for the benchmarks, everything is directly compiled by the baseline JIT and executed in baseline JIT tier.
Disclaimer: synthetic benchmarks are well-known to be misleading and unable to reflect real workloads (see [1,2,3,4]). The sole purpose of this section is to put our results within the context of the existing works, to give a rough sense on the performance of our baseline JIT.
Compilation Throughput
The top priority of a baseline JIT is to generate machine code as fast as possible. Therefore, our first evaluation is the compilation throughput.
We measured the compilation throughput of our baseline JIT by timing the main compilation function, which performs the end-to-end work of compiling a input Lua bytecode stream to machine code. We also recorded the total number of Lua bytecodes processed by the baseline JIT, and the total size of the generated machine code.
The average result over all 44 benchmarks is as follows:
In terms of Lua bytecodes processed per second, LJR’s baseline JIT can compile 19.1 million Lua bytecodes per second.
In terms of machine code generated per second, LJR’s baseline JIT can generate 1.62GB of machine code per second.
To demonstrate what 19.1 million Lua bytecodes means, the 44 Lua benchmark programs (254KB total) contains 17197 Lua bytecodes in total. So our baseline JIT generated machine code for all 44 benchmarks in less than one millisecond total.
As such, we claim that the compilation throughput of our baseline JIT is extremely fast, to the point that the start delay can be considered negligible[18].
Generated Code Performance
While the baseline JIT is designed to generate code fast, generating fast code is still a second priority.
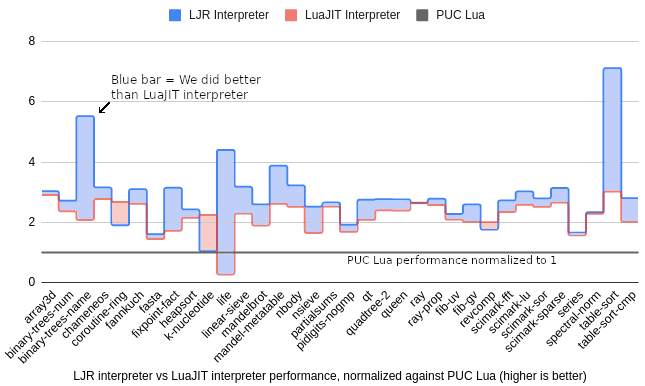
In this section, we will evaluate the execution performance of the machine code generated by LJR’s baseline JIT by comparing with LuaJIT and PUC Lua.
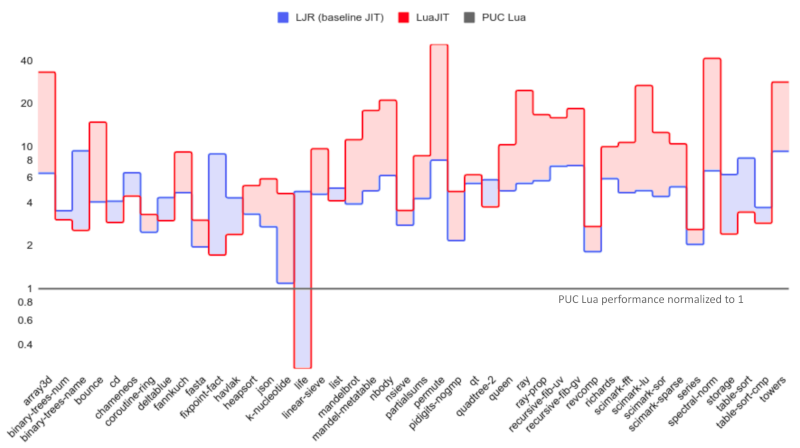
LJR and LuaJIT have drastically different high-level architecture, mid-level design and low-level implementation choices. For the most obvious part, a baseline JIT performs few optimizations by design, while the tracing JIT in LuaJIT does a lot of optimizations. Therefore, the sole purpose of the benchmark is to put the end performance of LJR’s baseline JIT within the context of the existing works, as shown in the figure below:
As one can see, LuaJIT’s optimizing tracing JIT generally works better than our baseline JIT, which is no surprise.
However, it’s worth noting that with IC as the only high-level optimization, we are already outperforming LuaJIT on 13 of the 44 benchmarks. On geometric average, we are about 34% slower than LuaJIT, and 4.6x faster than PUC Lua.
In my opinion, it is fair to say that Deegen is now on a very stable ground. With its excellent interpreter and baseline JIT that can already achieve pretty good execution performance at a negligble startup delay, the optimizing JIT (to come in the future) would have much less pressure in doing expensive optimizations.
Conclusion Thoughts and Future Works
This post demonstrated the second phase of the Deegen project – to build a high-performance baseline JIT compiler automatically from the bytecode semantic.
Of course, this is far from the end. Our next step is to automatically generate an optimizing compiler, which will likely follow the design of JavaScriptCore’s DFG lightweight JIT compiler. If you have any comments, suggestions or thoughts, please do not hesitate to shoot me an email :)
Acknowledgements
I thank Fredrik Kjolstad and Saam Barati for their comments and discussions on the draft version of this post. Fredrik also did the image editing work for the Add bytecode figure.
Footnotes
Since a JIT compiler works at runtime, the overall latency experienced by the user is the sum of the compilation time to generate the code (startup delay) and the execution time of the generated code. So for maximum throughput, one wants a multi-tier architecture. The baseline JIT is a JIT compiler that specializes at fast compilation, and is used to compile not-so-hot code. For a small set of hot functions identified by the baseline JIT, the optimizing JIT kicks in to generate better code at a much higher compilation cost. ↩︎
And even worse, due to the nature of assembly, there is little code sharing across the VM tiers or across hardware architectures, despite that all the VM tiers must stay in sync and exhibit identical behavior, or you get a VM bug. ↩︎
There are other reasons from the usability and engineering side as well. For example, by removing the “compile” step in the edit-compile-run cycle, dynamic languages have faster iterative development cycle. And libraries written in dynamic languages can be distributed as source code. ↩︎
Directly translating a dynamic language program to native code will result in a huge amount of native code. This is mainly due to the dynamic typed nature: every innocent operation in dynamic language is actually a huge switch depending on the input types, and can have drastically complex slow paths. The statically-generated logic must deal with all such cases for correctness, even though most of the slow paths are never hit at runtime. ↩︎
Recall that in most dynamic languages, functions are first-class value. So the function held by f can always be changed (and in fact, f is not even necessarily a function object), even though in the majority of use cases, the function is used like a C function so f always just hold the same value. ↩︎
This is the simplest strategy, but one can clearly do some fancier stuffs here. For example, JavaScriptCore will generate a binary search tree to reduce the number of jump instructions executed, so that they can support a higher number of IC entries. However, based on words from JSC developer, this optimization has very limited effect in practice. ↩︎
OSR stands for On-Stack Replacement. OSR-Exit is also more widely known as deoptimization, a technique originally used to enhance the debuggability of optimized code. However, we will stick to the term “OSR-Exit” as it better reflects the nature of this technique in the VM use case: exiting to a lower tier using an exotic method (on-stack replacement). ↩︎
Being an acute reader like you, I’m sure you can already imagine a primitive JIT that works by wiring up different functions that implement basic functionalities like constant, addition, pointer dereference, etc. ↩︎
While seemingly scary to mess up with assembly code directly, one can easily prove the correctness from the semantics of jmp. ↩︎
Acute readers might have noticed that this statement is not 100% true. We will revisit it later. ↩︎
Note that here, by saying register allocation and instruction selection, we meant those that work across stencils. Inside a stencil, since the code is compiled by LLVM, we already have good RA and ISel. ↩︎
The decision to give up non-local RA/ISel is justified by designs of existing state-of-the-art VMs. For example, in JavaScriptCore, only the fourth-tier heavyweight optimizing JIT (FTL) employs codegen-level optimizations (RA, ISel, etc.) that works across bytecode or DFG IR nodes. ↩︎
Unfortunately, I never realized the larger picture until after the Copy-and-Patch paper was already published, so this wrong belief is also published with the paper… ↩︎
Under small code model, and not considering complications like position-independent code (PIC) and position-independent executable (PIE). ↩︎
This is in fact an exaggregated statement. Hidden class without inline caching is much slower than a naive implementation (i.e., no hidden class at all). Therefore, if one were to actually seriously implement a baseline JIT without inline caching, he/she wouldn’t employ hidden class either. So IC is only responsible for a portion of the “>100% speedup on IC-intensive benchmarks”: the rest are the slowdown from the overhead of hidden class that could be avoided. ↩︎
One jump is clearly saved by not branching to the outlined JIT stub. If the IC happens to fallthrough to the logic directly after the SMC region (which is quite common), an additional jump can be saved. ↩︎
Note that the JIT code for a bytecode may consist of multiple stencils, for example, a Call needs both the main logic and the return continuation. Clearly, the jump-to-fallthrough transform is only valid for the last instruction of the last stencil for the bytecode. ↩︎
However, note that the memory overhead is not negligble at all: each Lua bytecode (which is usually a few bytes) expands to an average of 91 bytes of machine code in baseline JIT. This is why even with a baseline JIT, we still want programs to start executing in the interpreter. ↩︎
It is well-known that writing a good VM for a dynamic language is never an easy job. High-performance interpreters, such as the JavaScript interpreter in Safari, or the Lua interpreter in LuaJIT, are often hand-coded in assembly. If you want a JIT compiler for better performance, well, you’ve got some more assembly to write. And if you want the best possible performance with multiple-tier JIT compilation… Well, that’s assembly all the way down.
I have been working on a research project to make writing VMs easier. The idea arises from the following observation: writing a naive interpreter is not hard (just write a big switch-case), but writing a good interpreter (or JIT compiler) is hard, as it unavoidably involves hand-coding assembly. So why can’t we implement a special compiler to automatically generate a high-performance interpreter (and even the JIT) from “the big switch-case”, or more formally, a semantical description of what each bytecode does?
The LuaJIT Remake Project
I chose Lua as the experiment target for my idea, mainly because Lua is concise yet supports almost every language feature one can find in dynamic languages, including exotic ones like stackful coroutines. I named my project LuaJIT Remake (LJR) because in the long term, it will be a multi-tier method-based JIT compiler for Lua.
After months of work on the project, I’ve finally got some early results to share. LJR now has a feature-complete Lua 5.1 interpreter that is automatically generated at build time using a meta-compiler called Deegen (for “Dynamic language Execution Engine Generator”). More importantly, it is the world’s fastest Lua interpreter to date, outperforming LuaJIT’s interpreter by 28% and the official Lua interpreter by 171% on average on a variety of benchmarks[1].
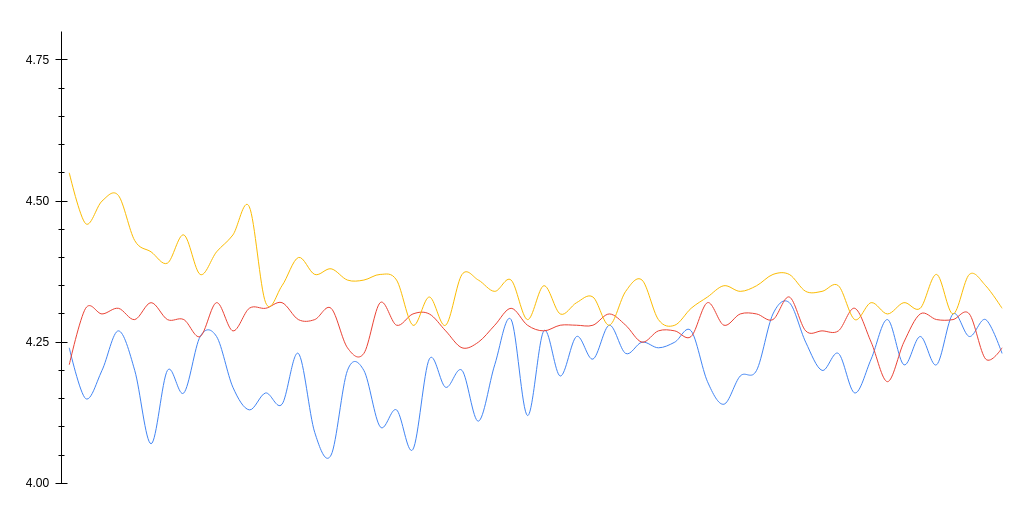
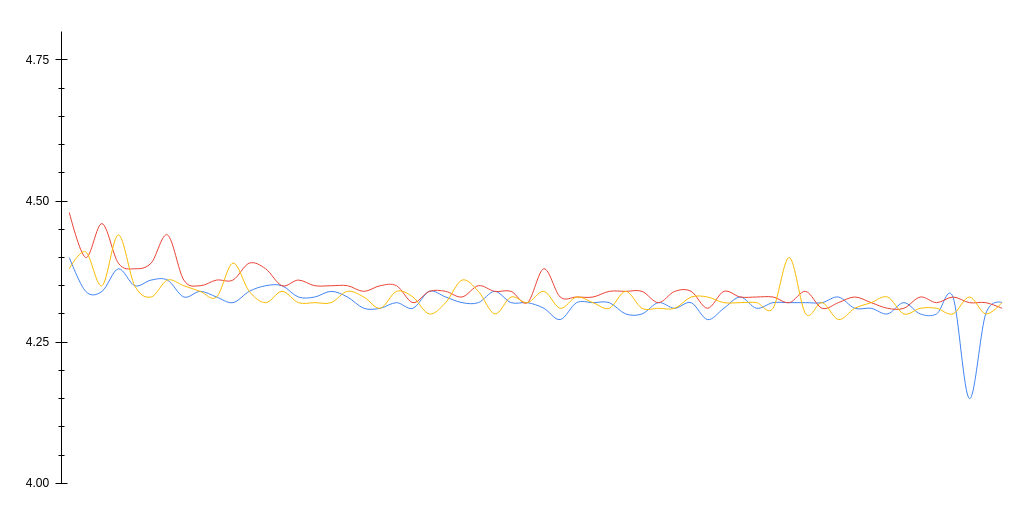
The figure below illustrates the performance of our interpreter, the LuaJIT interpreter, and the official PUC Lua interpreter. PUC Lua’s performance is normalized to 1 as a baseline.
As the figure shows, our interpreter performs better than LuaJIT’s hand-coded-in-assembly interpreter on 31 out of the 34 benchmarks[2], and on geometric average, we run 28% faster than LuaJIT interpreter, and almost 3x the speed of official PUC Lua.
Enough of the numbers, now I will dive a bit into how my approach works.
Why Assembly After All?
To explain how I built the fastest Lua interpreter, one needs to understand why (previously) the best interpreters have been hand-coded in assembly. This section is all about background. If you are already familiar with interpreters, feel free to skip to the next section.
Mike Pall, the author of LuaJIT, has explained this matter clearly in this great email thread back in 2011. The problem with the “big switch-case” approach is that C/C++ compilers simply cannot handle such code well. Although eleven years have passed, the situtation didn’t change much. Based on my experience, even if a function only has one fast path and one cold path, and the cold path has been nicely annotated with unlikely, LLVM backend will still pour a bunch of unnecessary register moves and stack spills into the fast path[3]. And for the “big switch-case” interpreter loop with hundreds of fast-paths and cold-paths, it’s unsurprising that compilers fail to work well.
Tail call, also known as continuation-passing style, is an alternative to switch-case-based interpreter loop. Basically each bytecode gets its own function that does the job, and when the job is done, control is transferred to the next function via a tail call dispatch (i.e., a jump instruction at machine code level). So despite that conceptually, the bytecode functions are calling each other, they are really jumping to each other at machine code level, and there will be no unbounded stack growth. An alternate way to look at it is that each “case” clause in the switch-case interpreter loop becomes a function. The “switch” will jump (i.e., tail call) to the corresponding “case” clause, and at the end of the case a jump (i.e., tail call) is executed to jump back to the switch dispatcher[4].
With the tail-call approach, each bytecode now gets its own function, and the pathological case for the C/C++ compiler is gone. And as shown by the experience of the Google protobuf developers, the tail-call approach can indeed be used to build very good interpreters. But can it push to the limit of hand-written assembly interpreters? Unfortunately, the answer is still no, at least at its current state.
The main blockade to the tail-call approach is the callee-saved registers. Since each bytecode function is still a function, it is required to abide to the calling convention, specifically, every callee-saved register must retain its old value at function exit. So if a bytecode function needs to use a callee-saved register, it needs to save the old value on the stack and restore it at the end[5]. The only way to solve this problem is to use a calling convention with no callee-saved registers. Unfortunately, Clang is (to-date) the only compiler that offers guaranteed-tail-call intrinsic ([[clang::musttail]] annotation), but it has no such user-exposed calling convention with no callee-saved registers. So you lose 6 (or 8, depending on cconv) of the 15 registers for no reason on x86-64, which is clearly bad.
Another blockade to the tail-call approach is, again, the calling convention. No unbounded stack growth is a requirement, but tricky problems can arise when the caller and callee function prototype does not match, and some parameters are being passed in the stack. So Clang makes the compromise and requires the caller and callee to have identical function prototypes if musttail is used. This is extremely annoying in practice once you have tried to write anything serious under such limitation (for POC purpose I had hand-written a naive Lua interpreter using musttail, so I have first-hand experience on how annoying it is).
Generating the Interpreter: Another Level Of Indirection Solves Everything
As you might have seen, the root of all the difficulties is that our tool (C/C++) is not ideal for the problem we want to solve. So what’s the solution?
Of course, throwing the tool away and resort to sheer force (hand-coding assembly) is one solution, but doing so also results in high engineering cost. Can we do it more swiftly?
It is well-known that all problems in computer science can be solved by another level of indirection. In our case, C/C++ is a very good tool to describe the semantics of each bytecode (i.e., what each bytecode should do), but C/C++ is not a good tool to write the most efficient interpreter. So what if we add one level of indirection: we write the bytecode semantical description in C++, compile it to LLVM IR, and feed the IR into a special-purpose compiler. The special-purpose compiler will take care of all the dirty work, doing proper transformation to the IR and finally generate a nice tail-call-based interpreter.
For example, at LLVM IR level, it is trivial to make a function use GHC calling convention (a convention with no callee-saved registers) and properly transform the function to unify all the function prototype, thus solving the two major problems with musttail tail calls that is unsolvable at C/C++ level. In fact, Deegen (our meta-compiler that generates the interpreter) does a lot more than producing the tail calls, which we will cover in the rest of this post.
Hide All the Ugliness Behind Nice APIs
In Deegen framework, the semantics of each bytecode is described by a C++ function. One of the most important design philosophy of Deegen is to abstract away all the nasty parts of an interpreter. I will demonstrate with a simplified example for the Add bytecode:
The function Add takes two boxed values (a value along with its type) lhs and rhs as input. It first checks if both lhs and rhs are double (the Is<tDouble>() check). If not, we throw out an error. Otherwise, we add them together by casting the two boxed value to its actual type (double) and do a normal double addition. Finally, we create a new boxed value of double type using TValue::Create<tDouble>(), return it as the result of the bytecode and dispatch to the next bytecode, through the Return() API call (note that this is not the C keyword return).
Notice how much nasty work we have abstracted away: decoding the bytecode, loading the operands and constants, throwing out errors, storing results to the stack frame, and dispatching to the next bytecode. All of these interpreter details either happen automatically, or happen with a simple API call (e.g., ThrowError or Return).
Now let’s extend our Add to add support for the Lua __add metamethod semantics:
1 2 3 4 5 6 7 8 9 10 11 12 13 14
voidAddContinuation(TValue /*lhs*/, TValue /*rhs*/){ Return(GetReturnValueAtOrd(0)); } voidAdd(TValue lhs, TValue rhs){ if (!lhs.Is<tDouble>() || !rhs.Is<tDouble>()) { /* we want to call metamethod now */ HeapPtr<FunctionObject> mm = GetMMForAdd(lhs, rhs); MakeCall(mm, lhs, rhs, AddContinuation); /* MakeCall never returns */ } else { double res = lhs.As<tDouble>() + rhs.As<tDouble>(); Return(TValue::Create<tDouble>(res)); } }
The GetMMForAdd is some arbitrary runtime function call that gets the metamethod. Deegen does not care about its implementation: the bytecode semantic description is just a normal C++ function, so it can do anything allowed by C++, of course including calling other C++ functions. The interesting part is the MakeCall API. It allows you to call other Lua functions with the specified parameters, and most importantly, a return continuation. The MakeCall API does not return. Instead, when the called function returns, control will be returned to the return continuation (the AddContinuation function). The return continuation function is similar to the bytecode function: it has access to all the bytecode operands, and additionally, it has access to all the values returned from the call. In our case, the semantics for Lua __add is to simply return the first value returned by the call as the result of the bytecode, so we use GetReturnValueAtOrd(0) to get that value, and use the Return API we have covered earlier to complete the Add bytecode and dispatch to the next bytecode.
Again, notice how much nasty work that we have abstracted away: all the details of creating the new Lua frame, adjusting the parameters and return values (overflowing arguments needs to go to variadic arg if callee accepts it, insufficient arguments need to get nil), transferring control to the callee functions, etc., are all hidden by a mere MakeCall API. Furthermore, all of these are language-neutral: if we were to target some other languages (e.g., Python), most of the Deegen code that implements the MakeCall could be reused.
The use of return continuation is designed to support Lua coroutines. Since Lua coroutines are stackful, and yield can happen anywhere (as yield is not a Lua keyword, but a library function), we need to make sure that the C stack is empty at any bytecode boundary, so we can simply tail call to the other continuation to accomplish a coroutine switch. This design also has a few advantages compared with PUC Lua’s coroutine implementation:
We have no fragile longjmps.
We can easily make any library function that calls into VM yieldable using this mechanism. In fact, the error message cannot yield across C call frames is gone completely in LJR: all Lua standard library functions, including exotic ones like table.sort, are redesigned to be yieldable using this mechanism.
Automation, Automation, and More Automation!
The bytecode semantic function specifies the execution semantics of the bytecode, but one still needs to specify the definition of the bytecode. For example, one needs to know that AddVN takes two operands where LHS is a bytecode slot and RHS is a number value in the constant table, and that AddVN returns one value, and that it always fallthroughs to the next bytecode and cannot branch to anywhere else. In Deegen, this is achieved by a bytecode specification language.
There are a few things going on here so we will go through them one by one. First of all, the DEEGEN_DEFINE_BYTECODE is a macro that tells us that you are defining a bytecode.
The Operands(...) API call tells us that the bytecode has two operands, with each can be either a bytecode slot (a slot in the call frame) or a constant in the constant table. Besides BytecodeSlotOrConstant, one can also use Literal to define literal operands, and BytecodeRange to define a range of bytecode values in the call frame.
The Result(BytecodeValue) API call tells us that the bytecode returns one value and does not branch. The enum key BytecodeValue means the bytecode returns one TValue. One can also use enum key CondBr to specify that the bytecode can branch, or just no argument to specify that the bytecode doesn’t return anything.
The Implementation(...) API specifies the execution semantics of the bytecode, which is the Add function we just covered.
The interesting part is the Variant API calls. It allows one to create different variants of the bytecode. For example, in Lua, we have the AddVV bytecode to add two bytecode values, or the AddVN bytecode to add a bytecode value with a constant double, or the ADDNV bytecode to add a constant double with a bytecode value. In a traditional interpreter implementation, the implementation of all of these bytecodes must be written by hand, which is not only laborious, but also error prone. However, in Deegen’s framework, all you need to do is to specify them as Variants, and we will do all the work for you!
The IsConstant API allows optionally further specifying the type of the constant, as shown in the IsConstant<tDoubleNotNaN>() usage in the snippet. Deegen implemented special LLVM optimization pass to simplify the execution semantics function based on the known and speculated type information of the operands. For example, for the bytecode variant where rhs is marked as IsConstant<tDoubleNotNaN>(), Deegen will realize that the rhs.Is<tDouble>() check in the bytecode function must be true, and optimize it out. This allows us to automatically generate efficient specialized bytecode implementation, without adding engineering cost to the user. (And by the way, the tDouble and tDoubleNotNaN things, or more formally, the type lattice of the language, is also user-defined. Deegen is designed to be a generic meta-compiler: it is not welded to Lua).
Finally, Deegen will generate a user-friendly CreateAdd function for the user frontend parser to emit a Add bytecode. For example, the frontend parser can write the following code to generate an Add bytecode that adds bytecode slot 1 with constant 123.4, and stores the output into slot 2:
The implementation of CreateAdd will automatically insert constants into the constant table, select the most suitable variant based in the input types (or throwing out an error if no satisfying variant can be found), and append the bytecode into the bytecode stream. The concrete layout of the bytecode in the bytecode stream is fully hidden from the user. This provides a maximally user-friendly and robust API for the user parser logic to build the bytecode stream.
This link is the real implementation of all the Lua arithemtic bytecodes in LuaJIT Remake. It used a few features that we haven’t covered yet: the DEEGEN_DEFINE_BYTECODE_TEMPLATE macro allows defining a template of bytecodes, so Add, Sub, Mul, etc., can all be defined at once, minimizing engineering cost. The EnableHotColdSplitting API allows automatically hot-cold-splitting based on speculated and proven input operand types, and splits out the cold path into a dedicated function, which improves the final code quality (recall the earlier discussion on the importance of hot-cold code splitting?).
And below is the actual disassembly of the interpreter generated by Deegen for Lua’s AddVV bytecode. Comments are manually added by me for exposition purposes:
__deegen_interpreter_op_Add_0: # decode 'lhs' from bytecode stream movzwl 2(%r12), %eax # decode 'rhs' from bytecode stream movzwl 4(%r12), %ecx # load the bytecode value at slot 'lhs' movsd (%rbp,%rax,8), %xmm1 # load the bytecode value at slot 'rhs' movsd (%rbp,%rcx,8), %xmm2 # check if either value is NaN # Note that due to our boxing scheme, # non-double value will exhibit as NaN when viewed as double # so this checks if input has double NaN or non-double value ucomisd %xmm2, %xmm1 # branch if input has double NaN or non-double values jp .LBB0_1 # decode the destination slot from bytecode stream movzwl 6(%r12), %eax # execute the add addsd %xmm2, %xmm1 # store result to destination slot movsd %xmm1, (%rbp,%rax,8) # decode next bytecode opcode movzwl 8(%r12), %eax # advance bytecode pointer to next bytecode addq $8, %r12 # load the interpreter function for next bytecode movq __deegen_interpreter_dispatch_table(,%rax,8), %rax # dispatch to next bytecode jmpq *%rax .LBB0_1: # branch to automatically generated slowpath (omitted) jmp __deegen_interpreter_op_Add_0_quickening_slowpath
As one can see, thanks to all of our optimizations, the quality of the assembly generated by Deegen has no problem rivalling hand-written assembly.
Inline Caching API: The Tricks of the Trade
A lot of LJR’s speedup over LuaJIT interpreter comes from our support of inline caching. We have rewritten the Lua runtime from scratch. In LJR, table objects are not stored as a plain hash table with an array part. Instead, our table implementation employed hidden classes, using a design mostly mirroring the hidden class design in JavaScriptCore.
Hidden class allows efficient inline caching, a technique that drastically speeds up table operations. Briefly speaking, one can think of a hidden class as a hash-consed metadata object that describes the layout of a table object, or (simplified for the purpose of exposition), a hash map from string key to the storage slot in the table storing the value of this string key.
Let’s use the TableGetById bytecode (aka, TGETS in LuaJIT) as example. TableGetById takes a table T and a fixed constant string k as input, and outputs T[k].
Due to the natural use case of dynamic languages, for a fixed TableGetById bytecode, the tables it operates on are likely to have the same hidden class, or only a few different kinds of hidden classes. So TableGetById will cache the most recent hidden class H it saw, as well as H[k], the storage slot in the table for the constant string key k. When TableGetById is executed on input T, it first check if the hidden class of T is just its cached hidden class H. If so (which is likely), it knows that the result must be stored in slot H[k] of T, so the expensive hash-lookup work (which queries hidden class H to obtain H[k]) can be elided.
In general, one can characterize the inline caching optimization as the following: there are some generic computation λ : input -> output that can be split into two steps:
An expensive but idempotent step λ_i : icKey -> ic where icKey is a subset of the input data, and ic is an opaque result.
A cheap but effectful step λ_e : <input, ic> -> output, that takes the input and the idempotent result ic for input in step 1, and outputs the final output.
If the computation satisfies such constraint, then one can cache icKey and the corresponding ic. Then on new inputs, if the icKey matches, the expensive idempotent step of computing ic can be safely elided.
Deegen provided generic inline caching APIs to allow easy employment of inline caching optimization. Specifically:
The full computation λ is specified as a C++ lambda (called the body lambda).
The effectful step λ_e is specified as C++ lambdas defined inside the body lambda (called the effect lambdas).
We allow specifying multiple possible effect lambdas in the body lambda, since the λ_e to execute can often be dependent on the outcome of the idempotent step. However, we require that at most one effect lambda can be executed in each run of the body lambda.
For example, for TableGetById, the code that employs inline caching would look like the following (simplified for the purpose of exposition):
voidTableGetById(TValue tab, TValue key){ // Let's assume 'tab' is indeed a table for simplicity. HeapPtr<TableObject> t = tab.As<tTable>(); // And we know 'key' must be string since the index of // TableGetById is required to be a constant string HeapPtr<String> k = key.As<tString>(); // Call API to create an inline cache ICHandler* ic = MakeInlineCache(); HiddenClassPtr hc = t.m_hiddenClass; // Make the IC cache on key 'hc' ic->Key(hc); // Specify the IC body (the function 'λ') Return(ic->Body([=] { // Query hidden class to get value slot in the table // This step is idempotent due to the design of hidden class int32_t slot = hc->Query(k); // Specify the effectful step (the function 'λ_e') if (slot == -1) { // not found return ic->Effect([] { return NilValue(); } } else { return ic->Effect([=] { return t->storage[slot]; }); } }); }
The precise semantic of the inline caching APIs is the following:
When ic->Body() executes for the first time, it will honestly execute the body lambda. However, during the execution, when a ic->Effect API call is executed, it will create an inline cache[6] for this bytecode that records the IC key (defined by the ic->Key() API), as well as all captures of this effect lambda that are defined within the body lambda. These variables are treated as constants (the ic state).
Next time the ic->Body executes, compare the cached key against the actual key.
If the key matches, it will directly execute the previously recorded effect lambda. For each capture of the effect lambda, if the capture is defined inside the body lambda, it will see the cached value recorded in step 1. Otherwise (i.e., the capture is defined as a capture of the body lambda), it will see the fresh value.
If the key does not match, just execute step 1.
The precise semantic might look a bit bewildering at first glance. A more intuitive way to understand is that one is only allowed to do idempotent computation inside the body lambda (idempotent is with respect to the cached key and other values known to be constants to this bytecode). All the non-idempotent computations must go to the effect lambda. As long as this rule is followed, Deegen will automatically generate correct implementation that employs the inline caching optimization.
Deegen also performs exotic optimizations that fuses the ordinal of the effect lambda into the opcode, to save an expensive indirect branch that branches to the correct effect implementation when the inline cache hits. Such optimizations would have required a lot of engineering efforts in a hand-written interpreter. But in Deegen, it is enabled by merely one line: ic->FuseICIntoInterpreterOpcode().
Below is the actual disassembly of the interpreter generated by Deegen, for TableGetById bytecode. The assembly is for a “fused-IC” quickened variant (see above) where the table is known to have no metatable, and the property exists in the inline storage of the table. As before, comments are manually added by me for exposition purposes.
__deegen_interpreter_op_TableGetById_0_fused_ic_1: pushq %rax # decode bytecode slot for the 'table' operand movzwl 2(%r12), %eax # decode bytecode slot for the 'index' operand movswq 4(%r12), %rcx # load the bytecode value of 'table' movq (%rbp,%rax,8), %r9 # load the constant value of 'index' (must be string) movq (%rbx,%rcx,8), %rsi # check that 'table' is a heap object value (a pointer) cmpq %r15, %r9 # if not, branch to slow path (omitted) jbe .LBB5_8 # decode the destination slot from the bytecode movzwl 6(%r12), %r10d # load the metadata struct offset for this bytecode # the contents of the inline cache is stored there movl 8(%r12), %edi # compute the pointer to the metadata struct addq %rbx, %rdi # load the hidden class of the heap object movl %gs:(%r9), %ecx # check if hidden class matches cmpl %ecx, (%rdi) # branch to code that calls the IC body if the hidden # class does not match (omitted) jne .LBB5_4 # The hidden class matched, we know the heap object is # a table without metatable, and the value for 'index' # is stored in the inline storage of the table, with the # slot ordinal recorded in the inline cache # Load the slot ordinal from the inline cache movslq 5(%rdi), %rax # load the value from the inline storage of the table movq %gs:16(%r9,%rax,8), %rax .LBB5_3: # store the value into the destination slot movq %rax, (%rbp,%r10,8) # decode next bytecode and dispatch movzwl 12(%r12), %eax addq $12, %r12 movq __deegen_interpreter_dispatch_table(,%rax,8), %rax popq %rcx jmpq *%rax
As one can see, in the good case of an IC hit, a TableGetById is executed with a mere 2 branches (one that checks the operand is a heap object, and one that checks the hidden class of the heap object matches the inline-cached value).
LuaJIT’s hand-written assembly interpreter is highly optimized already. Our interpreter generated by Deegen is also highly optimized, and in many cases, slightly better-optimized than LuaJIT. However, the gain from those low-level optimizations are simply not enough to beat LuaJIT by a significant margin, especially on a modern CPU with very good instruction-level parallelism, where having a few more instructions, a few longer instructions, or even a few more L1-hitting loads have negligible impact on performance. The support of inline caching is one of the most important high-level optimizations we employed that contributes to our performance advantage over LuaJIT.
Conclusion Thoughts and Future Works
In this post, we demonstrated how we built the fastest interpreter for Lua (to date) through a novel meta-compiler framework.
However, automatically generating the fastest Lua interpreter is only the beginning of our story. LuaJIT Remake is designed to be a multi-tier method-based JIT compiler generated by the Deegen framework, and we will generate the baseline JIT, the optimizing JIT, the tiering-up/OSR-exit logic, and even a fourth-tier heavyweight optimizing JIT in the future.
Finally, Deegen is never designed to be welded to Lua, and maybe in the very far future, we can employ Deegen to generate high-performance VMs at a low engineering cost for other languages as well.
Footnotes
The benchmarks are run on my laptop with Intel i7-12700H CPU and 32GB DDR4 memory. All benchmarks are repeated 5 times and the average performance is recorded. ↩︎
As a side note, two of the three benchmarks where we lost to LuaJIT are string processing benchmarks. LuaJIT seems to have some advanced string-handling strategy, yielding the speedup. However, the strategy is not perfect: it failed badly on the life benchmark, and as a result, LuaJIT got stomped 3.6x by PUC Lua (and 16x by us) on that benchmark. ↩︎
Some of these poor code come from insufficiently-optimized calling convention handling logic (e.g., LLVM often just pours all the spills at function entry for simplicity), and some comes from the register allocator that doesn’t have enough understanding of hot/cold path (so that it believes that hoisting a register move or a stack spill from the cold path into the fast path is an optimization while it actually isn’t). Compilers are always evolving and get better, but at least in this case it isn’t enough. ↩︎
One can also imagine an optimization that makes each “case” directly jumps to the next “case”, instead of the switch dispatcher. This is known as “direct threading” in the literature for continuation-passing-style-based interpreter, or more widely known as a “computed-goto interpreter” for switch-case-based interpreter (since GCC computed-goto extension is the most straightforward way to implement such an optimization). ↩︎
If one looks at the problem globally, clearly the better solution is to only save all the callee-saved registers once when one enters the interpreter, and restores it when the interpreter finishes, instead of having each bytecode function doing the same work again and again. But it’s impossible to tell the C/C++ compiler that “this function doesn’t need to abide to the calling convention, because by high-level design someone else will do the job for it”. ↩︎
In the current implementation, for the interpreter, each bytecode is only allowed to keep one inline cache entry, so the newly-created entry always overwrites the existing entry. However, for JIT compilers, each inline cache entry will be a piece of JIT-generated code, so there can be multiple IC entries for each bytecode. ↩︎
I recently hit the following use case in my project: I have a function RunAllPasses(obj), which runs a list of transformation passes on obj. All passes are independent from each other, so one can run them in any order. The problem is, I want to easily add new passes to the list of passes.
Of course one can manually maintain the list of passes, and call each of them. But this results in quite a bit of boilerplate code needed for each pass, and a lot of header files with each file merely having one function declaration for the pass.
Can we have less boilerplate code?
One intuitive direction is to have each pass “register” itself into a pass list at program initialization time, through the help of a global variable. For example, if one writes
1 2 3 4 5 6 7
// WARNING: It's probably not a good idea to use this... structRegisterMyPass { RegisterMyPass() { g_allPasses.push_back(MyPass); } }; RegisterMyPass g_registerMyPass;
Then the constructor of g_registerMyPass would automatically run when the program starts, and push the pass into a global pass list. The RunAllPasses function can then simply run each pass in the pass list.
However, this approach turns out to be the source of a stream of problems, which ultimately forced me to give up this approach. Long story short, let’s start with the experiment that led me to my conclusion.
Linker: The Deal-Breaker
Create a mini project with two C++ files, a.cpp and b.cpp.
a.cpp simply declares a global variable that has a constructor, which prints a message:
1 2 3 4 5 6 7 8
#include<bits/stdc++.h> structS { S() { fprintf(stderr, "In constructor S\n"); } }; // Declare global variable 's' inline S s;
and we get the expected output of In constructor S followed by In main. This shows that the C++ compiler indeed took care to preserve the global variable s from being pruned by the linker even if it is unused, which is good.
But if we make a.cpp a library, things break!
1 2 3 4 5 6
clang++ a.cpp -c -std=c++17 ar r mylib.a a.o clang++ b.cpp -c -std=c++17 clang++ b.o mylib.a ./a.out # The 'In constructor S' line won't be printed!
After further investigation, it turns out that the erratic behavior depends on whether the filea.cpp contains any symbols that are being used by the main program. For example, adding another file c.cpp into the static library won’t help, even if c.cpp contains a function used by the main program. But if we change the code a bit, so that a.cpp contains a function used by the main program, like the following:
1 2 3 4 5 6 7 8 9 10 11
// a.cpp #include<bits/stdc++.h> structS { S() { fprintf(stderr, "In constructor S\n"); } }; // Declare global variable 's' inline S s; // Declare a function used by b.cpp voidf(){ fprintf(stderr, "In function f\n");
Then, magically, the In constructor S line would be printed out again.
What’s the problem? As it turns out, if none of the symbols in some fileX of a static library is directly referenced by the main program, then the file X won’t be linked into the main program at all. And this “file-level pruning” ignores whatever “do-not-prune” annotation emitted by the C++ compiler in the file, since the file is not linked in altogether.
So I reached the conclusion that this approach is fundamentally fragile:
The irratic behavior won’t show up if the global variable is defined in an object file, only when it is defined in static libraries.
The irratic behavior won’t show up if the C++ file defining the global variable contains other declarations that is used by the main program.
There is no way (AFAIK) to fix this problem other than the -Wl,--whole-archive linker flag, which is not only fragile, but also a bad option because it unnecessarily bloats the final executable by often a lot.
The strict triggering condition means that the irratic behavior can hide undiscovered for a long time, until it is exposed by some completely irrelevant changes (e.g., moving a file to a static library, or moving some code around) and cause a debugging nightmare.
During the process, I also learned a number of C++-standard-imposed pitfalls about global variable constructor. I will only note one interesting example below.
The following code has undefined behavior, can you see why?
Answer: at the time the constructor of r runs, the constructor of g_list may not have run.
This is because according to C++ standard, “dynamic initialization of a non-block variable with static storage duration is unordered if the variable is an implicitly or explicitly instantiated specialization” (in our case, any instantiation of the variable r). Since std::map does not have a constexpr constructor, g_list is also dynamically initialized, so r may be initialized before g_list, even if g_list “appears” to be defined before r.
But isn’t Google Test using the same global variable trick?
The above question comes to my mind soon after I uploaded this post, so I gave it a try. The result is as expected: if I move my Google test files to a static library linked against the final unit test executable, all the tests are gone. Of course, for unit tests, there is absolutely no reason to make them a static library, so I would say Google Test made the completely correct design decision. However, for the general use cases, it seems unreasonable to silently introduce bugs when the code is linked as a static library.
I have a double, and I want to know if its value is an integer that fits in a int64_t. How can I do it in C++?
Ask any C++ newbie, and you will get an obvious “answer”: cast your double to int64_t, then cast it back to double, and compare if it equals your original number.
1 2 3
boolIsInt64(double d){ return d == static_cast<double>(static_cast<int64_t>(d)); }
!@#$%^&… Why? Shouldn’t it at least print either a 1 or a 0?
The Undefined Behavior
Here’s the reason: when you cast a floating-point value to an integer type, according to C/C++ standard, if the integral part of the value does not fit into the integer type, the behavior is undefined (by the way, casting special floating-point values NaN, INF, -INF to integer is also undefined behavior).
And unfortunately, Clang did the least helpful thing in this case:
It inlined the function IsInt64, so IsInt64(1e100) becomes expression 1e100 == (double)(int64_t)1e100.
It deduces that (int64_t)1e100 incurs undefined behavior since 1e100 does not fit into int64_t, so it evaluates to a special poison value (i.e., undefined).
Any expression on a poison value also produces poison. So Clang deduces that expression IsInt64(1e100) ? "1" : "0" ultimately evaluates to posion.
As a result, Clang deduces that the second parameter to printf is an undefined value. So in machine code, the whole expression is “optimized out”, and whatever junk stored in that register gets passed to printf. printf will interpret that junk value as a pointer and prints out whatever content at that address, yielding the junk output.
Note that even though gcc happens to produce the expected output in this case, the undefined behavior is still there (as all C/C++ compilers conform to the same C/C++ Standard), so there is no guarantee that the IsInt64 function above will work on gcc or any compiler.
So how to implement this innocent function in a standard-compliant way?
The Bad Fix Attempt #1
To avoid the undefined behavior, we must check that the double fits in the range of the int64_t before doing the casting. However, there’s a few tricky problems involved:
While -2^63 (the smallest int64_t) has an exact representation in double, 2^63-1 (the largest int64_t) doesn’t. So we must be careful about the rounding problems when doing the comparison.
Comparing the special floating-point value NaN with any number will yield false, so we must write our check in a way that NaN won’t pass the check.
There is another weird thing called negative zero (-0). For the purpose of this post, we treat -0 same as 0. If not, you will need another special check.
With these in mind, here’s the updated version:
1 2 3 4 5 6 7
boolIsInt64(double d){ if (-9223372036854775808.0 <= d && d < 9223372036854775808.0) { return d == static_cast<double>(static_cast<int64_t>(d)); } else { returnfalse; } }
However, unfortunately, while the above version is correct, it results in some unnecessarily terrible code on x86-64:
In fact, despite that out-of-range floating-point-to-integer cast is undefined behavior in C/C++, the x86-64 instruction cvttsd2si used above to perform the cast is well-defined on all inputs: if the input doesn’t fit in int64_t, then the output is 0x80000000 00000000. And since 0x80000000 00000000 has an exact representation in double, casting it back to double will yield -2^63, which won’t compare equal to any double value but -2^63.
So the range-check is actually unnecessary for the code to behave correctly on x86-64: it is only there to keep the C++ compiler happy, but unfortunately, the C++ compiler is unable to realize that such check is unnecessary on x86-64, thus cannot optimize it out on x86-64.
To summarize, on x86-64, all we need to generate is the last few lines of the above code.
1 2 3 4 5 6 7
IsInt64(double): # @IsInt64(double) cvttsd2si rax, xmm0 cvtsi2sd xmm1, rax cmpeqsd xmm1, xmm0 movq rax, xmm1 and eax, 1 ret
But is there any way we can teach the compiler to generate such assembly?
The Bad Fix Attempt #2
In fact, our original buggy implementation
1 2 3
boolIsInt64(double d){ return d == static_cast<double>(static_cast<int64_t>(d)); }
produces exactly the above assembly. The problem is, whenever the optimizer of the C++ compiler inlines this function and figures out that the input is a compile-time constant, it will do constant propagation according to C++ rule – and as a result, generate the poison value. So can we stop the optimizer from this unwanted optimization, while still having it doing optimizations properly for the rest of the program?
In fact, I have posted this question on LLVM forum months ago, and didn’t get an answer. But recently I suddenly had an idea. gcc and clang all support a crazy builtin named __builtin_constant_p. Basically this builtin takes one parameter, and returns true if the parameter can be proven by the compiler to be a compile-time constant[1]. Yes, the result of this function is dependent on the optimization level!
This builtin has a very good use case: to implement constexproffsetof. If you are certain that some expression p is a compile-time constant, you can do constexpr SomeType foo = __builtin_constant_p(p) ? p : p; to forcefully make p a constexpr, even if p is not constexpr by C++ standard, and the compiler won’t complain anything! This allows one to perform constexprreinterpret_cast between uintptr_t and pointers, thus implement a constexpr-version offsetof operator.
However, what I realized is that, this builtin can also be used to prevent the unwanted constant propagation. Specifically, we will check if (__builtin_constant_p(d)). If yes, we run the slow-but-correct code – this doesn’t matter as the optimizer is going to constant-fold the code anyway. If not, we execute the fast-but-UB-prone code, which is also fine because we already know the compiler can’t constant-fold anything to trigger the undefined behavior.
The new version of the code is below:
1 2 3 4 5 6 7 8 9 10 11 12 13 14
// DON'T USE IT! boolIsInt64(double d){ if (__builtin_constant_p(d)) { // Run UB-free version, knowing that it's going to // be constant-folded by the compiler any way if(-9223372036854775808.0 <= d && d < 9223372036854775808.0) { return d == static_cast<double>(static_cast<int64_t>(d)); } else { returnfalse; } } else { return d == static_cast<double>(static_cast<int64_t>(d)); } }
I tried the above code on a bunch of constants and non-constant cases, and the result seems good. Either the input is correctly constant-folded, or the good-version assembly is generated.
So I thought I outsmarted the compiler in this stupid Human-vs-Compiler game. But am I…?
Don’t Fight the Tool!
Why does C/C++ have this undefined behavior after all? Once I start to think about this problem, I begin to realize that something must be wrong…
The root reason that C/C++ Standard specifies that an out-of-range floating-point-to-integer cast is undefined behavior is because on different architectures, the instruction that performs the float-to-int cast exhibits different behavior when the floating-point value doesn’t fit in the integer type. On x86-64, the behavior of the cvttsd2si instruction in such cases is to produce 0x80000000 00000000, which is fine for our use case. But what about the other architectures?
As it turns out, on ARM64, the semantics of the fcvtzs instruction (analogue of x86-64’s cvttsd2si) is saturation: if the floating-point value is larger than the max value of the integer type, the max value is produced; similarly, if the floating-point value is too small, the minimum integer value is produced. So if the double is larger than 2^63-1, fcvtzs will produce 2^63-1, not -2^63 like in x86-64.
Now, recall that 2^63-1 doesn’t have an exact representation in double. When 2^63-1 is cast to double, it becomes 2^63. So if the input double value is 2^63, casting it to int64_t (fcvtzs x8, d0) will yield 2^63-1, and then casting it back to double (scvtf d1, x8) will yield 2^63 again. So on ARM64, our code will determine that the double value 2^63 fits in int64_t, despite that it actually does not.
I don’t own a ARM64 machine like Apple M1, so I created a virtual machine using QEMU to validate this. Without surprise, on ARM64, our function fails when it is fed the input 2^63.
So clearly, the undefined behavior is there for a reason…
Pick the Right Tool Instead!
As it turns out, I really should not have tried to outsmart the compiler with weird tricks. If performance is not a concern, then the UB-free version is actually the only portable and correct version:
1 2 3 4 5 6 7
boolIsInt64(double d){ if (-9223372036854775808.0 <= d && d < 9223372036854775808.0) { return d == static_cast<double>(static_cast<int64_t>(d)); } else { returnfalse; } }
And if performance is a concern, then it’s better to simply resort to architecture-dependent inline assembly. Yes, now a different implementation is needed for every architecture, but at least it’s better than dealing with hard-to-debug edge case failures.
Of course, the ideal solution is to improve the compiler, so that the portable version generates optimal code on every architecture. But given that neither gcc nor clang had supported this, I assume it’s not an easy thing to do.
Footnotes
Note that this builtin is different from the C++20 std::is_constant_evaluated(). The is_constant_evaluated only concerns whether a constexpr function is being evaluated constexpr-ly. However, __builtin_constant_p tells you whether a (maybe non-constexpr) expression can be deduced to a compile-time known constant under the current optimization level, so it has nothing to do with constexpr. ↩︎
TL;DR: Some of the P-cores in Alder Lake CPU can exhibit highly unstable performance behavior, resulting in large noise for any benchmark running on it.
UPDATE: A colleague of mine reported that the behavior can be observed on his i9-9980HK as well, and observed ~25% end-performance fluctuations on short-running benchmarks. So it seems like this behavior as been around for quite a while – dating back to at least the 9th-gen Intel CPU[1].
As a performance engineer, it’s routine to evaluate the performance before and after a code commit. This is why I’ve been faintly feeling that something is unusual about my new Intel Alder Lake i7-12700H laptop CPU.
Today I dug into the problem. As I discovered, this CPU indeed exhibits some highly unusual and surprising performance characteristics, which can easily cause pitfalls for benchmarks.
For background, Alder Lake features a hybrid architecture of the powerful P-cores and the weaker E-cores. i7-12700H has 6 P-cores and 8 E-cores. Of course, we want to have the P-cores run our time-sensitive tasks, such as our benchmarks. This can be done easily by taskset the process to only P-cores.
This is where the story begins. I noticed two problems with the P-cores:
Sometimes it cannot turbo-boost to 4.7GHz, the Intel-specified max turbo boost frequency (for the one-active-core case) for i7-12700H.
Sometimes it cannot stay at the highest CPU frequency it can boost to.
Point 1 implies that we cannot enjoy the full performance promoted by Intel. Point 2 implies that the core cannot deliver consistent performance, which is problematic for performance engineering, as the noise would make two benchmark runs less comparable.
Test Setup
To expose the problem, I wrote a dumb program that increments a variable in a dead loop, so that the frequency of the CPU running the program is maxed out. Then I use taskset to pin the program to one CPU, have it run for 60 seconds, and run cpufreq every second to record the frequency of that CPU in the duration[2].
I took the following precautions to ensure nothing outside the CPU chip is limiting the CPU from boosting to its max frequency:
Use isolcpus Linux kernel boot parameter to exclusively dedicate the tested CPU core to our test program. This removes any noise caused by the OS.
Confirm the CPU is not throttled by power limit: with only one active core (running our test program), the CPU package power consumption is less than 25W, far less than the base 45W TDP of i7-12700H.
Confirm the CPU is not temperature-throttled (by monitoring sensors). To be paranoid, I also set a 20s gap between each test so the temperature goes back to idle state.
Confirm the machine is in idle state, and stop unnecessary background services.
The CPU frequency governer is set to performance, and I confirmed that the governer is not limiting the turbo boost frequency.
Everything is at stock setting: nothing is overclocked or undervolted, etc.
All tests are repeated 3 times, and consistent behavior is observed for every core.
Not All P-cores Are Born Equal
The test confirmed my hypothesis that the 6 P-cores in my i7-12700H do not have a uniform quality. Specifically, my 6 P-cores exhibit three different performance characteriscs!
I dubbed them as “gold core”, “B-grade core”, and “wild core”:
Gold core: the core can boost to and stay at 4.7GHz, just as Intel claimed.
B-grade core: the core can boost to and stay at a frequency lower than 4.7GHz.
Wild core: the core cannot boost to 4.7GHz, and cannot stay at any stable frequency: it will fluctuate wildly between a range of frequencies, and the degree of turbulence also varies per core.
We will explain their performance characteristics below.
The “Wild Cores”
Let’s start with the most bizarre cores: the wild ones. As it turns out, 3 out of my 6 P-cores are wild (a whopping 50%!), and among those three cores, one of them is particularly wild, as shown in the plot below[3]:
As you can see, the CPU frequency turbulents violently from 4.05GHz to 4.55GHz, and each run exhibits a completely different pattern. Clearly, if any benchmark were run on this core, such a large noise would be a headache to deal with.
The other two wild cores I got were less turbulent. Even though, the noise introduced by the frequency instability still make them not ideal for benchmark comparison:
The “B-grade Cores”
The B-grade cores (as I dubbed) are better: while they cannot boost to 4.7GHz as promoted by Intel, at least they can operate at a consistent frequency, so benchmark results are comparable as long as they are run on the same core.
It turns out that my i7-12700H has two B-grade cores, both capable of operating at 4.5GHz:
As one can see, the core for the second graph has slightly higher frequency variations. Nevertheless, they are much stabler than the three wild cores.
The “Gold Core”
Only 1 out of the 6 P-cores of my i7-12700H matches Intel’s marketing[4]:
As one can see, it operates stably at about 4.68GHz, just as Intel claimed.
The Behavior of the E-cores
Unlike the P-cores, it turns out that the E-cores have extremely stable behavior. All the eight E-cores can boost to and stay at 3.5GHz, just as the Intel specification said. There is not even a single outlier point: as you can see in the figure, it’s a completely straight line.
Conclusion Thoughts
Given Intel’s tight testing and binning quality-control process, it seems very unlikely that I’m seeing all of these only because I got a defective. So I conjecture the “wild core” behavior can likely be observed on many i7-12700H CPUs.
Additionally, since i7-12700H is just the same i9-12900 chip with two below-quality P-cores disabled, it is also interesting to know if the behavior shows up on higher-end Alder Lake models, like the i9-12900K, as those presumably come from the better silicons, but I don’t have the ability to validate it.
Nevertheless, from a practicalist’s perspective, the action to take is clear: run the benchmark to identify the best cores and the performance-unstable cores on your chip, avoid running benchmarks on the performance-unstable cores, and use the best cores for the most latency-sensitive application.
For example, for my particular chip, physical core 2 (logical core 4-5) turns out to be the only “gold core”, so taskset -c 4 for single-threaded benchmark is a good idea. Similarly, for latency-sensitive multi-threaded application (like the QtCreator IDE, where UX is heavily affected by auto-completion latency), it is reasonable to modify the startup command in the desktop link to pin it to the good cores (logical core 0,1,4,5,8,9 in my particular chip).
But why?
I’m not expert at all, but my conjecture is that the increase in clock frequency and # of cores in recent CPUs might be the cause: due to silicon lottery, the max stable clock frequency is inherently different for each core. So as the chip gets more cores, it becomes exponentially harder to find chips where all cores in the chip match the spec frequency criteria – so maybe that’s why Intel loosened their criteria?
On the other hand, boost frequency is designed to go down as more cores become active. So in theory, having one golden core is actually enough, as long as the OS is aware of which core is golden, and assigns performance-demanding task to that core. However, it doesn’t seem to be the case yet, at least for my Ubuntu running Linux kernel 5.15.
Footnotes
On the other hand, my 7-th generation i7-7700HQ CPU does not have the problem described in this post. ↩︎
The full bash script for the test can be found here. For least noise, you should use isolcpus boot parameter to isolate a subset of CPUs, reboot, modify the script to only test the isolated subset, then change isolcpus to isolate the opposite set of CPUs, reboot, and modify the script to test the opposite set. ↩︎
The two logical CPUs of the physical core exhibit the same behavior, so I only show one of them. Same for other figures in this post. ↩︎
Though if you take a closer look at their specification, you’ll see what Intel claimed is “up to 4.7GHz”, so technically they did not lie, as they never claimed all cores can meet their specification – though, I guess, two cores 0.2GHz slower, two cores 0.35GHz slower and turbulent, one core 0.5GHz slower and highly turbulent is still, hmm. ↩︎
Javascript relies on garbage collection (GC) to reclaim memory. In this post, we will dig a little bit into JSC (the Javascript engine of WebKit)'s garbage collection system.
WebKit’s blog post on GC is a great post that explained the novelties of JSC’s GC and also positioned it within the context of various GC schemes in academia and industry. However, as someone with little GC background, I found WebKit’s blog post too hard to understand, and also too vague to understand the specific design used by JSC. So this blog post attempts to add in some more details, and aims to be understandable even by someone with little prior background on GC.
The garbage collector in JSC is non-compacting, generational and mostly[1]-concurrent. On top of being concurrent, JSC’s GC heavily employs lock-free programming for better performance.
As you can imagine, the design used by JSC is quite complex. So instead of diving into the complex invariants and protocols, we will start with the simplest design, and improve it step by step to converge at JSC’s design in the end. This way, we not only understand why JSC’s design works, but also how JSC’s design is reached.
But first of all, let’s get into some background.
Memory Allocation in JSC
Memory allocator and GC are tightly coupled by nature – the allocator allocates memory to be reclaimed by the GC, and the GC frees memory to be reused by the allocator. In this section, we will briefly introduce JSC’s memory allocators.
At the core of the memory allocation scheme in JSC is the data structure BlockDirectory[2]. It implements a fixed-sized allocator, that is, an allocator that only allocates memory chunks of some fixed size S. The allocator keeps tracks of a list of fixed-sized (in current code, 16KB) memory pages (“blocks”) it owns, and a free list. Each block is divided into cells of size S, and has a footer at its end[3], which contains various metadata information needed for GC and allocator, e.g., which cells are free. By aggregating and sharing metadata at the footer, it both saves memory and improves performance of related operations: we will go into details later.
When a BlockDirectory needs to make an allocation, it tries to allocate from its free list. If the free list is empty, it tries to iterate through the blocks it owns[4], to see if it can find a block containing free cells (which are marked free by GC). If yes, it scans the block footer metadata to find out all the free cells[5] in this block, and put into the free list. Otherwise, it allocates a new block from the OS[6]. Note that this implies a BlockDirectory’s free list only contains cells in one block: this is called m_currentBlock in the code, and we will revisit this later.
The BlockDirectory is used as the building block to build the memory allocators in JSC. JSC employs three kinds of allocators:
CompleteSubspace: this is a segregated allocator responsible for allocating small objects (max size about 8KB). Specifically, there is a pre-defined list of exponentially-growing size-classes[7], and one BlockDirectory is used to handle allocation for each size class. So to allocate an object, you find the smallest size class large enough to hold the object, and allocate from that size class.
PreciseAllocation: this is used to handle large allocations that cannot be handled by CompleteSubspace allocator[8]. It simply relies on the standard (malloc-like) memory allocator, though in JSC a custom malloc implementation called libpas is used. The downside is that since PreciseAllocation is done on a per-object basis, it cannot aggregate and share metadata information of multiple objects together to save memory and improve performance (as CompleteSubspace’s block footer did). Therefore, every PreciseAllocation comes with a whopping overhead of a 96-byte GC header to store the various metadata information needed for GC for this object (though this overhead is justified since each allocation is already at least 8KB).
IsoSubspace: each IsoSubspace is used to allocate objects of a fixed type with a fixed size. So each IsoSubspace simply holds a BlockDirectory to do allocation (though JSC also has an optimization for small IsoSubspace by making them backed by PreciseAllocation[9]). This is mainly a security hardening feature that makes use-after-free-based attacks harder[10].
As you can see, IsoSubspace is mostly a simplified CompleteSubspace, so we will ignore it for the purpose of this post. CompleteSubspace is the one that handles the common case: small allocations, and PreciseAllocation is mostly the rare slow path for large allocations.
Generational GC Basics
In JSC’s generational GC model, the heap consists of a small “new space” (eden), holding the newly allocated objects, and a large “old space” holding the older objects that have survived one GC cycle. Each GC cycle is either an eden GC or a full GC. New objects are allocated in the eden. When the eden is full, an eden GC is invoked to garbage-collect the unreachable objects in eden. All the surviving objects in eden are then considered to be in the old space[11]. To reclaim objects in the old space, a full GC is needed.
The effectiveness of the above scheme relies on the so-called “generational hypothesis”:
Most objects collected by the GC are young objects (died when they are still in eden), so eden GC (which only collects the eden) is sufficient to reclaim most of the memory.
Pointers from old space to eden is much rarer than pointers from eden to old space or pointers from eden to eden, so an eden GC’s runtime is approximately linear to the size of the eden, as it only needs to start from a small subset of the old space. This implies that the cost of GC can be amortized by the cost of allocation.
Inlined vs. Outlined Metadata: Why?
Practically every GC scheme uses some kind of metadata to track which objects are alive. In this section, we will explain how those metadata are stored in JSC, and the motivation behind such design.
In JSC, every object managed by the GC carries the following metadata:
Every object managed by GC inherit the JSCell class, which contains a 1-byte member cellState. This cellState is a color marker with two colors: white and black[12].
Every object also has two out-of-object metadata bits: isNew[13] and isMarked. For objects allocated by PreciseAllocation, the bits reside in the GC header. For objects allocated by CompleteSubspace, the bits reside in the block footer.
This may seem odd at first glance since isNew and isMarked could have been stored in the unused bits of cellState. However, this is intentional.
The inlined metadata cellState is easy to access for the mutator thread (the thread executing Javascript code), since it is just a field in the object. However, it has bad memory locality for GC and allocators, which need to quickly traverse through all the metadata of all objects in some block owned by CompleteSubspace (which is the common case). Outlined metadata have the opposite performance characteristics: they are more expensive to access for the mutator thread, but since they are aggregated into bitvectors and stored in the block footer of each block, GC and allocators can traverse them really fast.
So JSC keeps both inlined and outlined metadata to get the better of both worlds: the mutator thread’s fast path will only concern the inlined cellState, while the GC and allocator logic can also take advantage of the memory locality of the outlined bits isNew and isMarked.
Of course, the cost of this is a more complex design… so we have to unfold it bit by bit.
A Really Naive Stop-the-World Generational GC
Let’s start with a really naive design just to understand what is needed. We will design a generational, but stop-the-world (i.e. not incremental or concurrent) GC, with no performance optimizations at all. In this design, the mutator side transfers control to the GC subsystem at a “safe point”[14] to start a GC cycle (eden or full). The GC subsystem performs the GC cycle from the beginning to the end (as a result, the application cannot run during this potentially long period, thus “stop-the-world”), and then transfer control back to the mutator side.
For this purpose, let’s temporarily forget about CompleteSubspace: it is an optimized version of PrecisionAllocation for small allocations, and while it is an important optimization, it’s easier to understand the GC algorithm without it.
It turns out that in this design, all we need is one isMarked bit. The isMarked bit will indicate if the object is reachable at the end of the last GC cycle (and consequently, is in the old space, since any object that survived a GC cycle is in old space). All objects are born with isMarked = false.
The GC will use a breadth-first search to scan and mark objects. For full GC, we want to reset all isMarked bit to false at the beginnning, and do a BFS to scan and mark all objects reachable from GC roots. Then all the unmarked objects are known to be dead. For eden GC, we only want to scan the eden space. Fortunately, all objects in the old space are already marked at the end of the previous GC cycle, so they are naturally ignored by the BFS, so we can simply reuse the same BFS algorithm in full GC. In pseudo-code:
while (!queue.empty()) { JSCell* obj = queue.pop(); obj->ForEachChild([&](JSCell* child) { if (!child->isMarked) { child->isMarked = true; queue.push(child); } }); }
Eden/Full GC collection phase:
1 2 3 4 5
// One can easily imagine optimization to make eden collection // traverse only the eden space. We ignore it for simplicity. for (JSCell* obj : heap) if (!obj->isMarked) free(obj);
But where does the scan start, so that we can scan through every reachable object? For full GC, the answer is clear: we just start the scan from all GC roots[16]. However, for eden GC, in order to reliably scan through all reachable objects, the situation is slightly more complex:
Of course, we still need to push the GC roots to the initial queue.
If an object in the old space contains a pointer to an object in eden, we need to put the old space object to the initial queue[17].
The invariant for the second case is maintained by the mutator side. Specifically, whenever one writes a pointer slot of some object A in the heap to point to another object B, one needs to check if A.isMarked is true and B.isMarked is false. If so, one needs to put A into a “remembered set”. Eden GC must treat the objects in the remembered set as if they were GC roots. This is called a WriteBarrier. In pseudo-code:
1 2 3
// Executed after writing a pointer to 'dst' into a field of 'obj' if (obj->isMarked && !dst->isMarked) addToRememberedSet(obj);
Getting Incremental
The stop-the-world GC isn’t feasible for production use. A GC cycle (especially a full GC cycle) can take a long time. Since the mutator (application logic) cannot run during the period, the application would appear irresponsive to the user, which is very bad user experience.
A natural way to shorten this irresponsive period is to run GC incrementally: at safe points, the mutator transfers control to the GC. The GC only runs for a short time, doing a portion of the work for the current GC cycle (eden or full), then return control to the mutator. This way, each GC cycle is splitted into many small steps, so the irresponsive periods are less noticeable for the user.
Incremental GC poses a few new challenges to the GC scheme.
The first challenge is the extra interference between GC and mutator: the mutator side, namely the allocator and the WriteBarrier, must be prepared to see states arisen from a partially-completed GC cycle. And the GC side must correctly mark all reachable objects despite changes made by the mutator side in between.
Specifically, our full GC must change: imagine that the full GC scanned some object o and handed back control to mutator, then the mutator changed a field of o to point to some other object dst. The object dst must not be missed from scanning. Fortunately, in such case o will be isMarked and dst will be !isMarked (if dst has isMarked then it has been scanned, so there’s nothing to worry about), so o will be put into the remembered set.
Therefore, for full GC to function correctly in the incremental GC scheme, it must consider the remembered set as GC root as well, just like the eden GC.
The other parts of the algorithm as of now can remain unchanged (we leave the proof of correctness as an excerise for the reader). Nevertheless, “what happens if a GC cycle is run partially?” is something that we must keep in mind as we add more optimizations.
The second challenge is that the mutator side can repeatedly put an old space object into the remembered set, and result in redundant work for the GC: for example, the GC popped some object o in the remembered set, traversed from it, and handed over control to mutator. The mutator modified o again, putting it back to the remembered set. If this happens too often, the incremental GC could do a lot more work than a stop-the-world GC.
The obvious mitigation is to have the GC scan the remembered set last: only when the queue has otherwise been empty do we start popping from the remembered set. However, it turns out that this is not enough. JSC employs a technique called Space-Time Scheduler to further mitigate this problem. In short, if it obverves that the mutator was allocating too fast, the mutator would get decreasingly less time quota to run so the GC can catch up (and in the extreme case, the mutator would get zero time quota to run, so it falls back to the stop-the-world approach). The WebKit blog post has explained it very clearly, so feel free to take a look if you are interested.
Anyway, let’s update the pseudo-code for the eden/full GC marking phase:
1 2 3 4 5 6 7 8 9 10 11
while (!queue.empty() || !rmbSet.empty()) { // Both eden GC and full GC needs to consider remembered set // Prioritize popping from queue, pop remembered set last JSCell* obj = !queue.empty() ? queue.pop() : rmbSet.pop(); obj->ForEachChild([&](JSCell* child) { if (!child->isMarked) { child->isMarked = true; queue.push(child); } }); }
Incorporate in CompleteSubspace
It’s time to get our CompleteSubspace allocator back so we don’t have to suffer the huge per-object GC header overhead incurred by PreciseAllocation.
For PreciseAllocation, the actual memory management work is done by malloc: when the mutator wants to allocate an object, it just malloc it, and when the GC discovers a dead object, it just free it.
CompleteSubspace introduces another complexity, as it only allocate/deallocate memory from the OS at 16KB-block level, and does memory management itself to divide the blocks into cells that it serves to the application. Therefore, it has to track whether each of its cells is available for allocation. The mutator allocates from the available cells, and the GC marks dead cells as available for allocation again.
The isMarked bit is not enough for the CompleteSubspace allocator to determine if a cell contains a live object or not: newly allocated objects have isMarked = false but are clearly live objects. Therefore, we need another bit.
In fact, there are other good reasons that we need to support checking if a cell contains a live object or not. A canonical example is the conservative stack scanning: JSC cannot precisely understand the layout of the stack, so it needs to treat everything on the stack that could be pointers and pointing to live objects as GC root, and this involves checking if a heap pointer points to a live object or not.
One can easily imagine some kind of isLive bit that is true for all live objects, which is only flipped to false by GC when the object is dead. However, JSC employed a slightly different scheme, which is needed to facilitate optimizations that we will mention later.
As you have seen earlier, the bit used by JSC is called isNew.
However, keep in mind: you should not think of isNew as a bit that tells you anything related to its name, or indicates anything by itself. You should think of it as a helper bit, which sole purpose is that, when working togther with isMarked, they tell you if a cell contains a live object or not. This thinking mode will be more important in the next section when we introduce logical versioning.
The core invariant around isNew and isMarked is:
At any moment, an object is dead iff its isNew = false and isMarked = false.
If we were a stop-the-world GC, then to maintain this invariant, we only need the following:
When an object is born, it has isNew = true and isMarked = false.
At the end of each eden or full GC cycle, we set isNew of all objects to false.
Then, all newly-allocated objects are live because its isNew is true. At the end of each GC cycle, an object is live iff its isMarked is true, so after we set isNew to false (due to rule 2), the invariant on dead object is maintained, as desired.
However, in an incremental GC, since the state of a partially-run GC cycle can be exposed to mutator, we need to be careful that the invariant holds in this case as well.
Specifically, in full GC, we reset all isMarked to false at the beginning. Then, during a partially-run GC cycle, the mutator may see a live object with both isMarked = false (beacuse it has not been marked by GC yet), and isNew = false (because it has survived one prior GC cycle). This violates our invariant.
To fix this, at the beginning of a full GC, we additionally do isNew |= isMarked before clearing isMarked. Now, during the whole full GC cycle, all live objects must have isNew = true[18], so our invariant is maintained. At the end of the cycle, all isNew bits are cleared, and as a result, all the unmarked objects become dead, so our invariant is still maintained as desired. So let’s update our pseudo-code:
Eden GC preparation phase: no work is needed.
Full GC preparation phase:
1 2 3 4 5 6 7 8 9 10 11 12
// Do 'isNew |= isMarked, isMarked = false' for all // PreciseAllocation and all cells in CompleteSubspace for (PreciseAllocation* pa : allPreciseAllocations) { pa->isNew |= pa->isMarked; pa->isMarked = false; } for (BlockFooter* block : allCompleteSubspaceBlocks) { for (size_t cellId = 0; cellId < block->numCells; cellId++) { block->isNew[cellId] |= block->isMarked[cellId]; block->isMarked[cellId] = false; } }
Eden/Full GC collection phase:
1
2
3
4
5
6
7
8
9
10
11
12
13
// Update 'isNew = false' for CompleteSubspace cells for (BlockFooter* block : allCompleteSubspaceBlocks) { for (size_t cellId = 0; cellId < block->numCells; cellId++) { block->isNew[cellId] = false; } } // For PreciseAllocation, in addition to updating 'isNew = false', // we also need to free the dead objects for (PreciseAllocation* pa : allPreciseAllocations) { pa->isNew = false; if (!pa->isMarked) free(pa); }
In CompleteSubspace allocator, to check if a cell in a block contains a live object (if not, then the cell is available for allocation):
We are doing a lot of work at the beginning of a full GC cycle and at the end of any GC cycle, since we have to iterate through all the blocks in CompleteSubspace and update their isMarked and isNew bits. Despite that the bits in one block are clustered into bitvectors thus have good memory locality, this could still be an expensive operation, especially after we have a concurrent GC (as this stage cannot be made concurrent). So we want something better.
The optimization JSC employs is logical versioning. Instead of physically clearing all bits in all blocks for every GC cycle, we only bump a global “logical version”, indicating that all the bits are logically cleared (or updated). Only when we actually need to mark a cell in a block during the marking phase do we then physically clear (or update) the bitvectors in this block.
You may ask: why bother with logical versioning, if in the future we still have to update the bitvectors physically anyway? There are two good reasons:
If all cells in a block are dead (either died out during this GC cycle[19], or already dead before this GC cycle), then we will never mark anything in the block, so logical versioning enabled us to avoid the work altogether. This also implies that at the end of each GC cycle, it’s unnecessary to figure out which blocks become completely empty, as logical versioning makes sure that these empty blocks will not cause overhead to future GC cycles.
The marking phase can be done concurrently with multiple threads and while the mutator thread is running (our scheme isn’t concurrent now, but we will do it soon), while the preparation / collection phase must be performed single-threadedly and with the mutator stopped. Therefore, shifting the work to marking phase reduces GC latency in a concurrent setting.
There are two global version number g_markVersion and g_newVersion[20]. Each block footer also stores its local version number l_markVersion and l_newVersion.
Let’s start with the easier case: the logical versioning for the isNew bit.
If you revisit the pseudo-code above, in GC there is only one place where we write isNew: at the end of each GC cycle, we set all the isNew bits to false. Therefore, we simply bumpg_newVersion there instead. A local version l_newVersion smaller than g_newVersion means that all the isNew bits in this block have been logically cleared to false.
When the CompleteSubspace allocator allocates a new object, it needs to start with isNew = true. One can clearly do this directly, but JSC did it in a trickier way that involves a block-level bit named allocated for slightly better performance. This is not too interesting, so I deferred it to the end of the post, and our scheme described here right now will not employ this optimization (but is otherwise intentionally kept semantically equivalent as JSC):
When a BlockDirectory starts allocating from a new block, it update the the block’s l_newVersion to g_newVersion, and set isNew to true for all already-allocated cells (as the block may not be fully empty), and false for all available cells.
Whenever it allocates a cell, it sets its isNew to true.
Why do we want to bother setting isNew to true for all already-allocated cells in the block? This is to provide a good property. Since we bump g_newVersion at the end of every GC cycle, due to the scheme above, for any block with latest l_newVersion, a cell is live if and only if its isNew bit is set. Now, when checking if a cell is live, if its l_newVersion is latest, then we can just return isNew without looking at isMarked, so our logic is simpler.
The logical versioning for the isMarked bit is similar. At the beginning of a full GC cycle, we bump the g_markVersion to indicate that all mark bits are logically cleared. Note that the global version is not bumped for eden GC, since eden GC does not clear isMark bits.
There is one extra complexity: the above scheme would break down in incremental GC. Specifically, during a full GC cycle, we have logically cleared the isMarked bit, but we also didn’t do anything to the isNew bit, so all cells in the old space would appear dead to the allocator. In our old scheme without logical versioning, this case is prevented by doing isNew |= isMarked at the start of the full GC, but we cannot do it now with logical versioning.
JSC solves this problem with the following clever trick: during a full GC, we should also accept l_markVersion that is off-by-one. In that case, we know the isMarked bit accurately reflect whether or not a cell is live, since that is the result of the last GC cycle. If you are a bit confused, take a look at footnote[21] for a more elaborated case discussion. It might also help to take a look at the comments in the pseudo-code below:
boolcellContainsLiveObject(BlockFooter* block, size_t cellId){ if (block->l_newVersion == g_newVersion) { // A latest l_newVersion indicates that the cell is live if // and only if its 'isNew' bit is set, so we don't need to // look at the 'isMarked' bit even if 'isNew' is false return block->isNew[cellId]; } // Now we know isNew bit is logically false, so we should // look at the isMarked bit to determine if the object is live if (isMarkBitLogicallyCleared(block)) { // The isMarked bit is logically false returnfalse; } // The isMarked bit is valid and accurately tells us if // the object is live or not return block->isMarked[cellId]; }
// Return true if the isMarked bitvector is logically cleared boolisMarkBitLogicallyCleared(BlockFooter* block){ if (block->l_markVersion == g_markVersion) { // The mark version is up-to-date, so not cleared returnfalse; } if (IsFullGcRunning() && IsGcInMarkingPhase() && block->l_markVersion == g_markVersion - 1) { // We are halfway inside a full GC cycle's marking phase, // and the mark version is off-by-one, so the isMarked bit // should be accepted, and it accurately tells us if the // object is live or not returnfalse; } returntrue; }
Before we mark an object in CompleteSubspace, we need to update the l_markVersion of the block holding the cell to latest, and materialize the isMarked bits of all cells in the block. That is, we need to run the logic at the full GC preparation phase in our old scheme: isNew |= isMarked, isMarked = false for all cells in the block. This is shown below.
// Used by GC marking phase to mark an object in CompleteSubspace voidmarkObject(BlockFooter* block, size_t cellId){ aboutToMark(block); block->isMarked[cellId] = true; }
// Materialize 'isMarked' bits if needed // To do this, we need to execute the operation at full GC // prepare phase: isNew |= isMarked, isMarked = false voidaboutToMark(BlockFooter* block){ if (block->l_markVersion == g_markVersion) { // Our mark version is already up-to-date, // which means it has been materialized before return; } // Check if the isMarked bit is logically cleared to false. // The function is defined in the previous snippet. if (isMarkBitLogicallyCleared(block)) { // This means that the isMarked bitvector should // be treated as all false. So operation isNew |= isMarked // is no-op, so all we need to do is isMarked = false for (size_t cellId = 0; cellId < block->numCells; cellId++) { block->isMarked[cellId] = false; } } else { // The 'isMarked' bit is not logically cleared. Now let's // check if the 'isNew' bit is logically cleared. if (block->l_newVersion < g_newVersion) { // The isNew bitvector is logically cleared and should be // treated as false. So operation isNew |= isMarked becomes // isNew = isMarked (note that executing |= is incorrect // beacuse isNew could physically contain true!) for(size_t cellId = 0; cellId < block->numCells; cellId++) { block->isNew[cellId] = block->isMarked[cellId]; block->isMarked[cellId] = false; } // We materialized isNew, so update it to latest version block->l_newVersion = g_newVersion; } else { // The l_newVersion is latest, which means that the cell is // live if and only if its isNew bit is set. // Since isNew already reflects liveness, we do not have to // perform the operation isNew |= isMarked (and in fact, it // must be a no-op since no dead cell can have isMarked = // true). So we only need to do isMarked = false for(size_t cellId = 0; cellId < block->numCells; cellId++) { block->isMarked[cellId] = false; } } } // We finished materializing isMarked, so update the version block->l_markVersion = g_markVersion; }
A fun fact: despite that what we conceptually want to do above is isNew |= isMarked, the above code never performs a |= at all :)
And also, let’s update the pseudo-code for relavent GC logic:
Eden GC preparation phase: no work is needed.
Full GC preparation phase:
1 2 3 4 5 6 7 8 9
// For PreciseAllocation, we still need to manually do // 'isNew |= isMarked, isMarked = false' for every allocation for (PreciseAllocation* pa : allPreciseAllocations) { pa->isNew |= pa->isMarked; pa->isMarked = false; } // For CompleteSubspace, all we need to do is bumping the // global version for 'isMarked' bit g_markVersion++;
Eden/Full GC collection phase:
1 2 3 4 5 6 7 8 9 10 11
// For PreciseAllocation, we still need to manually // update 'isNew = false' for each allocation, and also // free the object if it is dead for (PreciseAllocation* pa : allPreciseAllocations) { pa->isNew = false; if (!pa->isMarked) free(pa); } // For CompleteSubspace, all we need to do is bumping the // global version for 'isNew' bit g_newVersion++;
With logical versioning, GC no longer sweeps the CompleteSubspace blocks to reclaim dead objects: the reclamation happens lazily, when the allocator starts to allocate from the block. This, however, introduces an unwanted side-effect. Some objects use manual memory management internally: they own additional memory that are not managed by GC, and have C++ destructors to free those memory when the object is dead. This improves performance as it reduces the work of GC. However, now we do not immediately sweep dead objects and run destructor, so the memory that are supposed to be freed by the destructor could be kept around indefinitely longer, if the block is never allocated from. To mitigate this issue, JSC will also periodically sweep the blocks and run the destructors of the dead objects. This is implemented by IncrementalSweeper, but we will not go into details.
To conclude, logical versioning provided two important optimizations to the GC scheme:
The so-called “sweep” phase of the GC (to find out and reclaim dead objects) is removed for CompleteSubspace objects. The reclamation is done lazily. This is clearly better than sweeping through the block again and again in every GC cycle.
The full GC does not need to reset all isMarked bit in the preparation phase, but only lazily reset them in the marking phase by aboutToMark: this not only reduces work, but also allows the work to be done parallelized and while the mutator is running, after we make our GC scheme concurrent.
Optimizing WriteBarrier: The cellState Bit
As we have explained earlier, whenever the mutator modified a pointer of a marked object o to point to an unmarked object, it needs to add o to the “remembered set”, and this is called the WriteBarrier. In this section, we will dig a bit deeper into the WriteBarrier and explain the optimizations around it.
The first problem with our current WriteBarrier is that the isMarked bit resides in the block footer, so retrieving its value requires quite a few computations from the object pointer. Also it doesn’t sit in the same CPU cache line as the object, which makes the access even slower. This is undesirable as the cost is paid for every WriteBarrier, no matter if we actually added the object to remembered set in the end or not.
The second problem is, our WriteBarrier will repeatedly add the same object o to the remembered set every time it is run. The obvious solution is to make rememberedSet a hash set to de-duplicate the objects it contains, but doing a hash lookup to check if the object already exists is still too expensive.
This is where the last metadata bit that we haven’t explained yet: the cellState bit comes in, which solves both problems.
Instead of making rememberedSet a hash table, we reserve a byte (though we only use 1 bit of it) named cellState in every object’s object header, to indicate if we might need to put the object into the remembered set in a WriteBarrier. Since this bit resides in the object header as an object field (instead of in the block footer), it’s trivially accessible to the mutator who has the object pointer.
cellState has two possible values: black and white. The most important two invariants around cellState are the following:
For any object with cellState = white, it is guaranteed that the object does not need to be added to remembered set.
Unless during a full GC cycle, all black (live) objects have isMarked = true.
Invariant 1 serves as a fast-path: WriteBarrier can return immediately if our object is white, and checking it only requires one load instruction (to load cellState) and one comparison instruction to validate it is white.
However, if the object is black, a slow-path is needed to check whether it is actually needed to add the object to remembered set.
Let’s look at our new WriteBarrier:
1 2 3 4 5
// Executed after writing a pointer to 'dst' into a field of 'obj' voidWriteBarrier(JSCell* obj){ if (obj->cellState == black) WriteBarrierSlowPath(obj); }
The first thing to notice is that the WriteBarrier is no longer checking if dst (the object that the pointer points to) is marked or not. Clearly this does not affect the correctness: we are just making the criteria less restrictive. However, it is unclear to me if we can improve performance while maintaining correctness by making some kind of check on dst as well, like the original WriteBarrier did.
I wasn’t able to get a definite answer on this even from JSC developer. They have two conjectures on why they are doing this: first, by not checking dst, more objects are put into the remembered set and need to be scanned by GC, so the total amount of work increased. However, the mutator’s work probably decreased, as it does less checks and touches less cache lines (by not touching the outlined isMarked bit). Of course, the benefit is offsetted by that the mutator is adding more objects into the remembered set, but this isn’t too expensive either, as the remembered set is only a segmented vector. GC has to do more work, as it needs to scan and mark more objects. However, after we make our scheme concurrent, the marking phase of GC can be done concurrently as the mutator is running, so the latency is probably[22] hidden. Second, JSC’s DFG compiler has optimization pass that coalesces barriers on the same object together, and the barrier emitted this way naturally cannot check dst. Therefore, to make things easier, they simply made all the barriers to not check dst. Although these are all conjectures, and it is unclear if adding back the dst check can improve performance, this is how JSC works, so let’s stick to it.
The interesting part is how the invariants above are maintained by the relavent parties. As always, there are three actors: the mutator (WriteBarrier), the allocator, and the GC.
The interaction with the allocator is the simplest. All objects are born white. This is correct because newly-born objects are not marked, so have no reason to be remembered.
The interaction with GC is during the GC marking phase:
When we mark an object and push it into the queue, we set its cellState to white.
When we pop an object from the queue, before we start to scan its children, we set its cellState to black.
In pseudo-code, the Eden/Full GC marking phase now looks like the following (Line 5 and Line 9 are the newly-added logic to handle cellState, other lines unchanged):
1
2
3
4
5
6
7
8
9
10
11
12
13
while (!queue.empty() || !rmbSet.empty()) { // Both eden GC and full GC needs to consider remembered set // Prioritize popping from queue, pop remembered set last JSCell* obj = !queue.empty() ? queue.pop() : rmbSet.pop(); obj->cellState = black; // <----------------- newly added obj->ForEachChild([&](JSCell* child) { if (!child->isMarked) { markObject(child); child->cellState = white; // <----------------- newly added queue.push(child); } }); }
Let’s argue why the invariant is maintained by the above code.
For invariant 1, note that in the above code, an object is white only if it is inside the queue (as once it’s popped out, it becomes black again), pending scanning of its children. Therefore, it is guaranteed that the object will still be scanned by the GC later, so we don’t need to add the object to remembered set, as desired.
For invariant 2, at the end of any GC cycle, any live object is marked, which means it has been scanned, so it is black, as desired.
Now let’s look at what WriteBarrierSlowPath should do. Clearly, it’s correct if it simply unconditionally add the object to remembered set, but that also defeats most of the purpose of cellState as an optimization mechanism: we want something better.
A top business of cellState is to prevent adding an object into the remembered set if it is already there. Therefore, after we put the object into the remembered set, we will set its cellState to white, like shown below.
Let’s prove why the above code works. Once we added an object to remembered set, we set it to white. We don’t need to add the same object into the remembered set until it gets popped out from the set by GC. But when GC pops out the object, it would set its cellState back to black, so we are good.
JSC employed one more optimization. During a full GC, we might see black objects that has isMarked = false (note that this is the only possible case that the object is unmarked, due to invariant 2). In this case, it’s unnecessary to add the object to remembered set, since the object will eventually be scanned in the future (or it becomes dead some time later before it was scanned, in which case we are good as well). Furthermore, we can flip it back to white, so we don’t have to go into this slow path the next time a WriteBarrier on this object runs. To sum up, the optimized version is as below:
1 2 3 4 5 6 7 8 9 10 11 12 13 14 15
voidWriteBarrierSlowPath(JSCell* obj){ if (IsFullGcRunning()) { if (!isMarked(obj)) { // Do not add the object to remembered set // In addition, set cellState to white so this // slow path is not triggered on the next run obj->cellState = white; return; } } else { assert(isMarked(obj)); // due to invariant 2 } obj->cellState = white; addToRememberedSet(obj); }
Getting Concurrent and Getting Wild
At this point, we already have a very good incremental and generational garbage collector: the mutator, allocator and GC all have their respective fast-paths for the common cases, and with logical versioning, we avoided redundant work as much as possible. In my humble opinion, this is a good balance point between performance and engineering complexity.
However, obviously, “engineering complexity” is not a word inside JSC’s dictionary: after all, they have the most talented engineers, to the point that they even engineered their own purpose-built LLVM from scratch!
To squeeze out every bit of performance, JSC proceeded to make the GC scheme concurrent. However, due to the nature of GC, it’s often infeasible to use locks to protect against race conditions for performance reasons, so extensive lock-free programming is employed.
But once lock-free programming is involved, one starts to get into all sorts of architecture-dependent memory reordering problems. x86-64 is the more sane architecture: it only requires StoreLoadFence(), and it provides somewhat-TSO-like semantics, but JSC also needs ARM64 support for their Apple Sillicon devices. ARM64 has even fewer guarantees: load-load, load-store, store-load, and store-store can all be reordered by the CPU, so any innocent operation could actually need a fence. As if things were not bad enough, for performance reasons, JSC does not want to use too many memory fences on ARM64. So they have the so-called Dependencyclass, which creates an implicit CPU data dependency on ARM64 through some scary assembly hacks, so they can get the desired memory ordering for a specific data-flow without paying the cost of a memory fence. As you can imagine, with all of these complications and optimizations, the code can easily become horrifying.
So due to my limited expertise, it’s unsurprising if I missed to explain or mis-explained some important race conditions in the code, especially some ARM64-specific ones: if you spotted any issue in this post, please definitely let me know.
Let’s go through the concurrency assumptions first. Javascript is a single-threaded language, so there is always only one mutator thread[23]. Apart from the mutator thread, JSC has a bunch of compilation threads, a GC thread, and a bunch of marking threads. Only the GC marking phase is concurrent: during which the mutator thread, the compiler threads, and a bunch of marking threads are concurrently running (yes, the marking itself is also done in parallel). However, all the other GC phases are run with the mutator thread and compilation threads stopped.
Some Less Interesting Issues
First of all, clearly the isMarked and isNew bitvector must be made safe for concurrent access, since multiple threads (including marking threads and mutator) may concurrently update it. Using CAS with appropriate retry/bail mechanism is enough for the bitvector itself.
BlockFooter is harder, and needs to be protected with a lock: multiple threads could be simutanuously calling aboutToMark(), so aboutToMark() must be guarded. For the reader side (the isMarked() function, which involves first checking if l_markVersion is latest, then reading the isMarked bitvector), in x86-64 thanks to x86-TSO, one does not need a lock or any memory fence (as long as aboutToMark takes care to update l_markVersion after the bitvector). In ARM64, since load-load reordering is allowed, a Dependency is required.
Making the cellContainsLiveObject (or in JSC jargon, isLive) check lock-free is harder, since it involves potentially reading both the isMarked bit and the isNew bit. JSC employs optimistic locking to provide a fast-path. This is not very different from an optimistic locking scheme you can find in a textbook, so I won’t dive into the details.
Of course, there are a lot more subtle issues to change. Almost all the pseudo-code above needs to be adapted for concurrency, either by using a lock or CAS, or by using some sort of memory barriers and concurrency protocol to ensure that the code works correctly under concurrency settings. But now let’s turn to some more important and tricky issues.
The Race Between WriteBarrier and Marking
One of the most important race is the race between WriteBarrier and GC’s marking threads. The marking threads and the mutator thread can access the cellState of an object concurrently. For performance reasons, a lock is infeasible, so race condition arises.
It’s important to note that we call WriteBarrierafter we have written the pointer into the object. This is not only more convenient to use (especially for JIT-generated code), but also allows a few optimizations: for example, in certain cases, multiple writes to the same object may only call WriteBarrier once at the end.
With this in mind, let’s analyze why our current implementation is buggy. Suppose o is an object, and the mutator wants to store a pointer to another object target into a field f of o. The marking logic of GC wants to scan o and append its children into the queue. We need to make sure that GC will observe the o -> target pointer link.
Let’s first look at the correct logic:
Mutator (WriteBarrier)
GC (Marker)
Store(o.f, target)
StoreLoadFence() // WriteBarrier begin
t1 = Load(o.cellState)
if (t1 == black): WriteBarrierSlowPath(o)
Store(o.cellState, black)
StoreLoadFence()
t2 = Load(o.f) // Load a children of o
Do some check to t2 and push it to queue
This is mostly just a copy of the pseudocode in the above sections, except that we have two StoreLoadFence(). A StoreLoadFence() guarantees that no LOAD after the fence may be executed by the CPU out-of-order engine until all STORE before the fence have completed. Let’s first analyze what could go wrong without either of the fences.
Just to make things perfectly clear, the precondition is o.cellState = white (because o is in the GC’s queue) and o.f = someOldValue.
What could go wrong if the mutator WriteBarrier doesn’t have the fence? Without the fence, the CPU can execute the LOAD in line 3 before the STORE in line 1. Then, in the following interleaving:
[Mutator Line 3] t1 = Load(o.cellState) // t1 = white
[GC Line 1] Store(o.cellState, black)
[GC Line 3] t2 = Load(o.f) // t2 = some old value
[Mutator Line 1] Store(o.f, target)
Now, the mutator did not add o to remembered set (because t1 is white, not black), and t2 in GC is the old value in o.f instead of target, so GC did not push target into the queue. So the pointer link from o to target is missed in GC. This can result in target being wrongly reclaimed despite it is live.
And what could go wrong if the GC marking logic doesn’t have the fence? Similarly, without the fence, the CPU can execute the LOAD in line 3 before the STORE in line 1. Then, in the following interleaving:
[GC Line 3] t2 = Load(o.f) // t2 = some old value
[Mutator Line 1] Store(o.f, target)
[Mutator Line 3] t1 = Load(o.cellState) // t1 = white
[GC Line 1] Store(o.cellState, black)
Similar to above, mutator sees t1 = white and GC sees t2 = oldValue. So o is not added to remembered set, and target is not pushed into the queue, the pointer link is missed.
Finally, let’s analyze why the code behaves correctly if both fences are present. Unfortunately there is not a better way than manually enumerating all the interleavings. Thanks to the fences, Mutator Line 1 must execute before Mutator Line 3, and GC Line 1 must execute before GC Line 3, but the four lines can otherwise be reordered arbitrarily. So there are 4! / 2! / 2! = 6 possible interleavings. So let’s go!
Interleaving 1:
[Mutator Line 1] Store(o.f, target)
[Mutator Line 3] t1 = Load(o.cellState) // t1 = white
[GC Line 1] Store(o.cellState, black)
[GC Line 3] t2 = Load(o.f) // t2 = target
In this interleaving, the mutator did not add o to remembered set, but the GC sees target, so it’s fine.
Interleaving 2:
[GC Line 1] Store(o.cellState, black)
[GC Line 3] t2 = Load(o.f) // t2 = some old value
[Mutator Line 1] Store(o.f, target)
[Mutator Line 3] t1 = Load(o.cellState) // t1 = black
In this interleaving, GC saw the old value, but the mutator added o to the remembered set, so GC will eventually drain from the remembered set and scan o again, at which time it will see the correct new value target, so it’s fine.
Interleaving 3:
[Mutator Line 1] Store(o.f, target)
[GC Line 1] Store(o.cellState, black)
[Mutator Line 3] t1 = Load(o.cellState) // t1 = black
[GC Line 3] t2 = Load(o.f) // t2 = target
In this interleaving, GC saw the new value target, nevertheless, the mutator saw t1 = black and added o to the remembered set. This is unfortunate since GC will scan o again, but it doesn’t affect correctness.
Interleaving 4:
[Mutator Line 1] Store(o.f, target)
[GC Line 1] Store(o.cellState, black)
[GC Line 3] t2 = Load(o.f) // t2 = target
[Mutator Line 3] t1 = Load(o.cellState) // t1 = black
Same as Interleaving 3.
Interleaving 5:
[GC Line 1] Store(o.cellState, black)
[Mutator Line 1] store(o.f, target)
[Mutator Line 3] t1 = Load(o.cellState) // t1 = black
[GC Line 3] t2 = Load(o.f) // t2 = target
Same as Interleaving 3.
Interleaving 6:
[GC Line 1] Store(o.cellState, black)
[Mutator Line 1] Store(o.f, target)
[GC Line 3] t2 = Load(o.f) // t2 = target
[Mutator Line 3] t1 = Load(o.cellState) // t1 = black
Same as Interleaving 3.
This proves that with the two StoreLoadFence(), our code is no longer vulnerable to the above race condition.
Another Race Condition Between WriteBarrier and Marking
The above fix alone is not enough: there is another race between WriteBarrier and GC marking threads. Recall that in WriteBarrierSlowPath, we attempt to flip the object back to white if we saw it is not marked (this may happen during a full GC), as illustrated below:
It turns out that, after setting the object white, we need to do a StoreLoadFence(), and check again if the object is marked. If it becomes marked, we need to set obj->cellState back to black.
Without the fix, the code is vulnerable to the following race:
[Precondition] o.cellState = black and o.isMarked = false
[WriteBarrier] Check isMarked() // see false
[GC Marking] CAS(o.isMarked, true), Store(o.cellState, white), pushed 'o' into queue
[GC Marking] Popped 'o' from queue, Store(o.cellState, black)
[WriteBarrier] Store(o.cellState, white)
[Postcondition] o.cellState = white and o.isMarked = true
The post-condition is bad because o will not be added to the remembered set in the future, despite that it needs to be (as the GC has already scanned it).
Let’s now prove why the code is correct when the fix is applied. Now the WriteBarrier logic looks like this:
[WriteBarrier] Store(o.cellState, white)
[WriteBarrier] t1 = isMarked()
[WriteBarrier] if (t1 == true): Store(o.cellState, black)
Note that we omitted the first “Check isMarked()” line because it must be the first thing executed in the interleaving, as otherwise the if-check won’t pass at all.
The three lines in WriteBarrier cannot be reordered by CPU: Line 1-2 cannot be reordered because of the StoreLoadFence(), line 2-3 cannot be reordered since line 3 is a store that is only executed if line 2 is true. The two lines in GC cannot be reordered by CPU because line 2 stores to the same field o.cellState as line 1.
In addition, note that it’s fine if at the end of WriteBarrier, the object is black but GC has only executed to line 1: this is unfortunate, because the next WriteBarrier on this object will add the object to the remembered set despite it’s unnecessary. However, it does not affect our correctness. So now, let’s enumerate all the interleavings again!
Interleaving 1.
[WriteBarrier] Store(o.cellState, white)
[WriteBarrier] t1 = isMarked() // t1 = false
[WriteBarrier] if (t1 == true): Store(o.cellState, black) // not executed
Object is not marked and white, OK.
Interleaving 2.
[WriteBarrier] Store(o.cellState, white)
[WriteBarrier] t1 = isMarked() // t1 = false
[GC Marking] CAS(o.isMarked, true), Store(o.cellState, white), pushed 'o' into queue
[WriteBarrier] if (t1 == true): Store(o.cellState, black) // not executed
Object is in queue and white, OK.
Interleaving 3.
[WriteBarrier] Store(o.cellState, white)
[GC Marking] CAS(o.isMarked, true), Store(o.cellState, white), pushed 'o' into queue
[WriteBarrier] t1 = isMarked() // t1 = true
[WriteBarrier] if (t1 == true): Store(o.cellState, black) // executed
Object is in queue and black, unfortunate but OK.
Interleaving 4.
[GC Marking] CAS(o.isMarked, true), Store(o.cellState, white), pushed 'o' into queue
[WriteBarrier] Store(o.cellState, white)
[WriteBarrier] t1 = isMarked() // t1 = true
[WriteBarrier] if (t1 == true): Store(o.cellState, black) // executed
Object is in queue and black, unfortunate but OK.
Interleaving 5.
[WriteBarrier] Store(o.cellState, white)
[WriteBarrier] t1 = isMarked() // t1 = false
[GC Marking] CAS(o.isMarked, true), Store(o.cellState, white), pushed 'o' into queue
[GC Marking] Popped 'o' from queue, Store(o.cellState, black)
[WriteBarrier] if (t1 == true): Store(o.cellState, black) // not executed
Object is marked and black, OK.
Interleaving 6.
[WriteBarrier] Store(o.cellState, white)
[GC Marking] CAS(o.isMarked, true), Store(o.cellState, white), pushed 'o' into queue
[WriteBarrier] t1 = isMarked() // t1 = true
[GC Marking] Popped 'o' from queue, Store(o.cellState, black)
[WriteBarrier] if (t1 == true): Store(o.cellState, black) // executed
Object is marked and black, OK.
Interleaving 7.
[GC Marking] CAS(o.isMarked, true), Store(o.cellState, white), pushed 'o' into queue
[WriteBarrier] Store(o.cellState, white)
[WriteBarrier] t1 = isMarked() // t1 = true
[GC Marking] Popped 'o' from queue, Store(o.cellState, black)
[WriteBarrier] if (t1 == true): Store(o.cellState, black) // executed
Object is marked and black, OK.
Interleaving 8.
[WriteBarrier] Store(o.cellState, white)
[GC Marking] CAS(o.isMarked, true), Store(o.cellState, white), pushed 'o' into queue
[GC Marking] Popped 'o' from queue, Store(o.cellState, black)
[WriteBarrier] t1 = isMarked() // t1 = true
[WriteBarrier] if (t1 == true): Store(o.cellState, black) // executed
Object is marked and black, OK.
Interleaving 9.
[GC Marking] CAS(o.isMarked, true), Store(o.cellState, white), pushed 'o' into queue
[WriteBarrier] Store(o.cellState, white)
[GC Marking] Popped 'o' from queue, Store(o.cellState, black)
[WriteBarrier] t1 = isMarked() // t1 = true
[WriteBarrier] if (t1 == true): Store(o.cellState, black) // executed
Object is marked and black, OK.
Interleaving 10.
[GC Marking] CAS(o.isMarked, true), Store(o.cellState, white), pushed 'o' into queue
[GC Marking] Popped 'o' from queue, Store(o.cellState, black)
[WriteBarrier] Store(o.cellState, white)
[WriteBarrier] t1 = isMarked() // t1 = true
[WriteBarrier] if (t1 == true): Store(o.cellState, black) // executed
Object is marked and black, OK.
So let’s update our pseudo-code. However, I would like to note that, in JSC’s implementation, they did not use a StoreLoadFence() after obj->cellState = white. Instead, they made the obj->cellState = white a CAS from black to white (with memory ordering memory_order_seq_cst). This is stronger than a StoreLoadFence() so their logic is also correct. Nevertheless, just in case my analysis above missed some other race with other components, our pseudo-code will stick to their logic…
The WriteBarrier is now free of hazardous race conditions. However, we are executing a StoreLoadFence() for every WriteBarrier, which is a very expensive CPU instruction. Can we optimize it?
The idea is the following: the fence is used to protect against race with GC. Therefore, we definitely need the fence if the GC is concurrently running. However, the fence is unnecessary if the GC is not running. Therefore, we can check if the GC is running first, and only execute the fence if the GC is indeed running.
JSC is even smarter: instead of having two checks (one that checks if the GC is running and one that checks if the cellState is black), it combines them into a single check for the fast-path where the GC is not running and the object is white. The trick is the following:
Assume black = 0 and white = 1 in the cellState enum.
Create a global variable called blackThreshold. This blackThreshold is normally 0, but at the beginning of a GC cycle, it will be set to 1, and it will be reset back to 0 at the end of the GC cycle.
Now, check if obj->cellState > blackThreshold.
Then, if the check succeeded, we know we can immediately return: the only case this check can succeed is when the GC is not running and we are white (because blackThreshold = 0 and cellState = 1 is the only situation to pass the check). This way, the fast path only executes one check. If the check fails, then we fallback to the slow path, which performs the full procedure: check if GC is running, execute a fence if needed, then check if cellState is black again. In pseudo-code:
1 2 3 4 5 6 7 8 9 10 11 12 13 14 15 16 17 18 19
voidWriteBarrier(JSCell* obj){ if (obj->cellState > g_blackThreshold) { // Fast-path: the only way to reach here is when // the GC is not running and the cellState is white return; } if (!IsGcRunning()) { // g_blackThreshold is 0, so our object is // actually black, we need to go to WriteBarrierSlowPath WriteBarrierSlowPath(obj); } else { // GC is running so we need to execute the fence // and check cellState again StoreLoadFence(); if (obj->cellState == black) { WriteBarrierSlowPath(obj); } } }
Note that there is no race between WriteBarrier and GC setting/clearing IsGcRunning() flag and changing the g_blackThreshold value, because the mutator is always stopped at a safe point (of course, halfway inside WriteBarrier is not a safe point) when the GC starts/finishes.
“Obstruction-Free Double Collect Snapshot”
Concurrent GC also introduced new complexities for the ForEachChild function used by GC marking phase to scan all objects referenced by a certain object. Each Javascript object has a Structure (aka, hidden class) that describes how the content of this object shall be interpreted into object fields. Since the GC marking phase is run concurrently with the mutator, and the mutator may change the Structure of the object, and may even change the size of the object’s butterfly, GC must be sure that despite the race conditions, it will never crash by dereferencing invalid pointers and never miss to scan a child. Using a lock is clearly infeasible for performance reasons. JSC uses a so-called obstruction-free double collect snapshot to solve this problem. Please refer to the Webkit GC blog post to see how it works.
Some Minor Design Details and Optimizations
You might find this section helpful if you want to actually read and understand the code of JSC, but otherwise feel free to skip it: these details are not centric to the design, and are not particularly interesting either. I mention them only to bridge the gap between the GC scheme explained in this post and the actual implementation in JSC.
As explained earlier, each CompleteSubspace owns a list of BlockDirectory to handle allocations of different sizes; each BlockDirectory has an active block m_currentBlock where it allocates from, and it achieves this by holding a free list of all available cells in the block. But how does it work exactly?
As it turns out, each BlockDirectory has a cursor, which is reset to point at the beginning of the block list at the end of an eden or full GC cycle. Until it is reset, it can only move forward. The BlockDirectory will move the cursor forward, until it finds a block containing available cells, and allocate from it. If the cursor reaches the end of the list, it will attempt to steal a 16KB block from another BlockDirectory and allocate from it. If that also failed, it will allocate a new 16KB block from OS and allocate from it.
I also mentioned that a BlockDirectory uses a free list to allocate from the currently active block m_currentBlock. It’s important to note that in the actual implementation of JSC, the cells in m_currentBlock does not respect the rule for isNew bit. Therefore, to check liveness, one either need to do a special-case check to see if the cell is from m_currentBlock (for example, see HeapCell::isLive), or, for the GC[24], stop the mutator, destroy the free list (and populate isNew in the process), do whatever inspection, then rebuild the free list and resume the mutator. The latter is implemented by twofunctions named stopAllocating() and resumeAllocating(), which are automatically called whenever the world is stopped or resumed.
The motivation of allowing m_currentBlock to not respect the rule for isNew is (a tiny bit of) performance. Instead of manually setting isNew to true for every allocation, a block-level bit allocated (aggregated as a bitvector in BlockDirectory) is used to indicate if a block is full of live objects. When the free list becomes empty (i.e., the block is fully allocated), we simply set allocated to true for this block. When querying cell liveness, we check this bit first and directly return true if it is set. The allocated bitvector is cleared at the end of each GC cycle, and since the global logical version for isNew is also bumped, this effectively clears all the isNew bits, just as we desired.
JSC’s design also support the so-called constraint solver, which allows specification of implicit reference edges (i.e., edge not represented as pointer in the object). This is mainly used to support Javascript interaction with DOM. This part is not covered in this post.
Weak reference has multiple implementations in JSC. The general (but less efficient) implementation is WeakImpl, denoting a weak reference edge. The data structure managing them is WeakSet, and you can see it in every block footer, and in every PreciseAllocation GC header. However, JSC also employs more efficient specialized implementations to handle the weak map feature in Javascript. The details are not covered in this post.
In JSC, objects may also have destructors. There are three ways the destructors are run. First, when we begin allocating from a block, destructors of the dead cells are run. Second, the IncrementalSweeper periodically scans the blocks and runs destructors. Finally, when the VM shuts down, the lastChanceToFinalize() function is called to ensure that all destructors are run at that time. The details of lastChanceToFinalize() are not covered in this post.
JSC employs a conservative approach for pointers on the stack and in registers: the GC uses UNIX signals to suspend the mutator thread, so it can copy its stack contents and CPU register values to search for data that looks like pointers. However, it’s important to note that UNIX signal is not used to suspend the execution of the mutator: the mutator always actively suspends itself at a safe point. This is critical, as otherwise it could be suspended at weird places, for example, in a HeapCell::isLive check after it has read isNew but before it has read isMarked, and then GC did isNew |= isMarked, isMarked = false, and boom. So it seems like the only reason to suspend the thread is for the GC to get the CPU register values, including the SP register value so the GC knows where the stack ends. It’s unclear to me if it’s possible to do so in a cooperative manner instead of using costly UNIX signals.
Acknowledgements
I thank Saam Barati from JSC team for his enormous help on this blog post. Of course, any mistakes in this post are mine.
Footnotes
Brief stop-the-world pause is still required at the start and end of each GC cycle, and may be intentionally performed if the mutator thread (i.e. the thread running Javascript code) is producing garbage too fast for the GC thread to keep up with. ↩︎
The actual allocation logic is implemented in LocalAllocator. Despite that in the code BlockDirectory is holding a linked list of LocalAllocator, (at time of writing, for the codebase version linked in this blog) the linked list always contains exactly one element, so the BlockDirectory and LocalAllocator is one-to-one and can be viewed as an integrated component. This relationship might change in the future, but it doesn’t matter for the purpose of this post anyway. ↩︎
Since the footer resides at the end of a 16KB block, and the block is also 16KB aligned, one can do a simple bit math from any object pointer to access the footer of the block it resides in. ↩︎
Similar to that per-cell information is aggregated and stored in the block footer, per-block information is aggregated as bitvectors and stored in BlockDirectory for fast lookup. Specifically, two bitvectors empty and canAllocateButNotEmpty track if a block is empty, or partially empty. The code is relatively confusing because the bitvectors are layouted in a non-standard way to make resizing easier, but conceptually it’s just one bitvector for each boolean per-block property. ↩︎
While seemingly straightforward, it is not straightforward at all (as you can see in the code). The free cells are marked free by the GC, and due to concurrency and performance optimization the logic becomes very tricky: we will revisit this later. ↩︎
In fact, it also attempts to steal blocks from other allocators, and the OS memory allocator may have some special requirements required for the VM, but we ignore those details for simplicity. ↩︎
In the current implementation, the list of sizes (byte) are 16, 32, 48, 64, 80, then 80 * 1.4 ^ n for n >= 1 up to about 8KB. Exponential growth guarantees that the overhead due to internal fragmentation is at most a fraction (in this case, 40%) of the total allocation size. ↩︎
An interesting implementation detail is that IsoSubspace and CompleteSubspace always return memory aligned to 16 bytes, but PreciseAllocation always return memory address that has reminder 8 module 16. This allows identifying whether an object is allocated by PreciseAllocation with a simple bit math. ↩︎
JSC has another small optimization here. Sometimes a IsoSubspace contains so few objects that it’s a waste to hold them using a 16KB memory page (the block size of BlockDirectory). So the first few memory pages of IsoSubspace use the so-called “lower-tier”, which are smaller memory pages allocated by PreciseAllocation. In this post, we will ignore this design detail for simplicity. ↩︎
Memory of an IsoSubspace is only used by this IsoSubspace, never stolen by other allocators. As a result, a memory address in IsoSubspace can only be reused to allocate objects of the same type. So for any type A allocated by IsoSubspace, even if there is a use-after-free bug on type A, it is impossible to allocate A, free it, allocate type B at the same address, and exploit the bug to trick the VM into interpreting an integer field in B controlled by attacker as a pointer field in A. ↩︎
In some GC schemes, an eden object is required to survive two (instead of one) eden GC to be considered in old space. The purpose of such design is to make sure that any old space object is at least one eden-GC-gap old. In contrast, in JSC’s design, an object created immediately before an eden collection will be considered to be in old space immediately, which then can only be reclaimed via a full GC. The performance difference between the two designs is unclear to me. I conjecture JSC chose its current design because it’s easier to make concurrent. ↩︎
There is one additional color Grey in the code. However, it turns out that White and Grey makes no difference (you can verify it by grepping all use of cellState and observe that the only comparison on cellState is checking if it is Black). The comments explaining what the colors mean are also a bit outdated. This is likely a historical artifact. In my opinion JSC should really clean it up and update the comment, as it can easily cause confusion to readers who intend to understand the design. ↩︎
The bit is actually called isNewlyAllocated in the code. We shorten it to isNew for convenience in this post. ↩︎
Safe point is a terminology in GC. At a safe point, the heap and stack is in a coherent state understandable by the GC, so the GC can correctly trace out which objects are dead or live. ↩︎
For PreciseAllocation, all allocated objects are chained into a linked list, so we can traverse all objects (live or dead) easily. This is not efficient: we will explain the optimizations for CompleteSubspace later. ↩︎
Keep in mind that while this is true for now, as we add more optimizations to the design, this will no longer be true. ↩︎
Note that we push the old space object into the queue, not the eden object, because this pointer could have been overwritten at the start of the GC cycle, making the eden object potentially collectable. ↩︎
Also note that all objects dead before this GC cycle, i.e. the free cells of a block in CompleteSubspace, still have isNew = false and isMarked = false, as desired. ↩︎
Recall that under generational hypothesis, most objects die young. Therefore, that “all objects in an eden block are found dead during eden GC” is something completely plausible. ↩︎
In JSC, the version is stored in a uint32_t and they have a bunch of logic to handle the case that it overflows uint32_t. In my humble opinion, this is an overoptimization that results in very hard-to-test edge cases, especially in a concurrent setting. So we will ignore this complexity: one can easily avoid these by spending 8 more bytes per block footer to have uint64_t version number instead. ↩︎
Note that any number of eden GC cycles may have run between the last full GC cycle and the current full GC cycle, but eden GC does not bump mark version. So for any object born before the last GC cycle (no matter eden or full), the isMarked bit honestly reflect if it is live, and we will accept the bit as its mark version must be off-by-one. For objects born after the last GC cycle, it must have a latest isNew version, so we can know it’s alive through isNew. In both cases, the scheme correctly determines if an object is alive, just as desired. ↩︎
And probably not: first, true sharing and false sharing between GC and mutator can cause slowdown. Second, as we have covered before, JSC uses a Time-Space Scheduler to prevent the mutator from allocating too fast while the GC is running. Specifically, the mutator will be intentionally suspended for at least 30% of the duration. So as long as the GC is running, the mutator suffers from an 30%-or-more “performance tax”. ↩︎
The real story is a bit more complicated. JSC actually reuse the same VM for different Javascript scripts. However, at any moment, at most one of the script can be running. So technically, there are multiple mutually-exclusive mutator threads, but this doesn’t affect our GC story. ↩︎
The GC needs to inspect a lot of cells, and its logic is already complex enough, so having one less special-case branch is probably beneficial for both engineering and performance. ↩︎
Recently I decided to get a new laptop to replace my 5-years-old one. I happened to discover something called “barebone laptop”, which are essentially laptops with no RAM or SSD installed and no brand logo painted.
The barebone laptop manufacturers generally only provide bulk sale to OEM manufacturers. Since retail sale is not possible directly, there is a niche market for buying in barebone laptops in bulk and resell them to end customers, and there are small business who live on this niche, which is the easiest way for one to buy a barebone.
Apart from being more environment-friendly (by reusing the RAM and SSD from the old laptop), the main advantage of a barebone is the price. My new Clevo NP70PNP bought from R&J Tech (a barebone reseller business) is $1300, while a Dell laptop with the identical configuration[1] is sold at $2650. It’s surprising that Dell at least doubled the price[2] by simply plugging in the RAM and SSD and painting their logo on top[3], and their customers are still happily buying it.
Anyway, let’s get back to the topic. My experience is that the Clevo NP70PNP can work very well with Ubuntu, though a few tweaks are needed. The hardest part is that it’s very hard to find the necessary tweaks in Google due to the unpopularity of barebone laptops, which is why I’m taking notes here.
It has the Intel AX201 Wifi card, which doesn’t work in Ubuntu 20.04, and the reason is the kernel version, so not fixable by manually installing the firmware. However, Ubuntu 22.04 (just released last month) supports the Wifi card out of the box.
The Ubuntu 22.04 live-USB black screens on regular boot, but can be fixed by selecting safe graphics at boot menu. It’s a pain – for whatever reason it takes 10 minutes to load the desktop, but fortunately this is only needed for live-USB install: after the install, the GPU driver and the graphics work fine.
The touchpad (model FTCS1000:01 2808:0102) is the one that took me the longest to make work. It works initially, but would fail randomly after some time. After a lot of fruitless googling, it turns out that the GPU setting is the problem! (I seriously have no idea why.) As it turns out, the fix is to disable MS Hybrid for GPU. One can do this either in BIOS (in Advanced Chip Settings, switch the option from MS Hybrid to Discrete GPU Only), or in Ubuntu NVIDIA X Server Settings (in PRIME settings choose Performance).
Even after the tweak, there are still some minor issues with touchpad. Specifically, the feature that automatically disables touchpad when external mouse is present or while typing does not work, since for some reason the touchpad cannot be disabled from xinput. However, for some reason, it can still be disabled in GNOME by bash command gsettings set org.gnome.desktop.peripherals.touchpad send-events disabled. So I wrote a udev rule to automatically disable the touchpad on external mouse plugging in and re-enable it when the external mouse is plugged out. Googling any udev rule tutorial should be sufficient. Automatically disabling touchpad on typing seems much harder.
There are some minor issue with Bluetooth. For some reason, with AD2P Sink, there is a 0.5s delay in playing music. The problem doesn’t exist with HSP, though the audio quality of HSP is considerably lower. I haven’t figured out how to fix the problem since I usually use a headset.
For some reason, whenever the GPU is under load, the fan would spin at max speed (even if the GPU temperature is only 40 C or so), and the noise is a bit too loud. And it seems like neither the NVIDIA GPU driver nor fancontrol could even detect the fan, not to mention controlling it, though I haven’t dig into this issue too deep either, since it’s not too problematic for my use case.
Other than the issues mentioned above, everything works out of the box under Ubuntu 22.04, including all my external devices and all Fn hotkeys (except the one that disables touchpad).
For the hardware side, IMO the model has only two minor design drawbacks: there are only two USB ports (and one of it is USB 2.0, seriously, why?); and the plastic hull seems relatively fragile and has many very thin parts, so I’m a bit concerned if the hull would break in an accident someday. The weight and the battery life are also not the best on the market, though they are definitely within reasonable range for a 17.3" performance-oriented laptop, and also I’m not too concerned about them for my use case.
Overall, I would recommend it as a great laptop at a great price for Ubuntu users.
Footnotes
CPU model, GPU model, screen size, screen resolution are all identical. The barebone doesn’t come with RAM or SSD, but the Dell $2650 model has the worst RAM and SSD that is sold at $30 on Amazon. ↩︎
In fact, I would conjecture they tripled the price: given that R&J is such a small business and how fast laptop hardware models get outdated, I guess the bulk bought-in price from Clevo is likely much less than $1000. ↩︎
Of course, they also install Windows, but a Windows license not that expensive either, and also I don’t use Windows… ↩︎
While Javascript has a simple syntax, what happens behind the scene is far from simple. For example, consider this innocent-looking hypot function below:
1
2
3
var hypot = function(a, b) { returnMath.sqrt(a * a + b * b); }
It is clear what Math.sqrt does: it performs a square root. However, to actually execute Math.sqrt(...), a lot of steps are needed:
First, get the global object, where all global variables reside in.
Then, get the Math property of the global object. Normally the Math property exists (since it is predefined), but we can’t know for sure: if someone had indeed run delete Math; before, we must promptly throw out an error.
Next, get the sqrt property of Math. Note that we cannot even be certain that Math is an object (as someone could have done Math = 123;). So as in (2), we must not omit any check for error.
Finally, similarly, what the sqrt property contains can be anything. Even if it is a function, it could be any function. So as before, we must not omit any check, and if sqrt is indeed a Javascript function, we perform the Javascript function call.
So, in order to correctly (as every Javascript engine needs to be) execute this innocently looking Math.sqrt, a ton of stuffs must be done.
How can we make this faster?
The crucial observation is that while the programmer is technically allowed to do anything, including insane things like delete Math; or Math = 123, most sane programs will not do it. So for practical purposes, it is enough if we can make sane programs both correct and fast, while running insane programs only correctly.
In JSC (WebKit’s Javascript engine), this is achieved by Watchpoint.
Conceptually, a WatchpointSet represents a condition that one expects to be true, or simply put, a watchable condition. For example, we may expect the global object to contain property Math, and its value being equal to the predefined Math object.
One may attach Watchpoints to the WatchpointSet. A Watchpoint is essentially a callback: after attaching to a WatchpointSet, when the condition represented by the WatchpointSet becomes false, the callback is invoked (“fired”), so the owner who created the Watchpoint can react correspondingly.
While the watchpoint mechanism isn’t necessarily binded to JIT Compilation (for example, LLIntPrototypeLoadAdaptiveStructureWatchpoint works without JIT), it is most powerful when combined with JIT Compilation. We generate code that is optimized assuming the watchpoint condition holds, so inside the generated code, we don’t check for the condition at all. If the condition no longer holds, we must jettison the code – this is expensive, because all the work we did to generate the code is wasted, but the whole point of watchpoint is that such bad cases should happen only rarely.
A Motivating Example
Let’s go back to the Math.sqrt example: we want to get notified when a property of an object changes value. Therefore, all logic that writes value into object properties must cooperate with us. For simplicity, let’s assume the object Math has a Structure, say S. Then, there are two kinds of logic that may write to object properties:
The C++ code that implements object property writes (the slow paths).
The JIT’ed code that writes to a specific property of a specific structure (the fast paths).
The fast paths are known as inline caches. Inline caching is probably the most important optimization in JSC, but I will leave its details to another post. For the purpose of this post, it’s sufficient to think of each inline cache fast-path as a JIT-compiled piece of code that is specialized for a certain structure S and a certain property name prop. Given a value and an object with structure S, it writes value to property prop of the object.
The slow path case is easy to handle: whenever one writes to a property of an object, one checks whether there are Watchpoints watching the condition, and fire them. Of course, we are doing one extra check for every object property write. However, those code are already slow paths, so it doesn’t hurt too much to make them a bit more slower.
The fast path case is trickier. A naive solution is to add a watchpoint check, as how we handled slow-path. However, this is unsatisfactory: now, every fast-path write is doing one extra check! We can afford slowing down the slow-path, but we want to keep the fast-path fast.
So, the fast-path must not check for watchpoint conditions it violates at runtime. Instead, we permenantly invalidate any and all WatchpointSet it could violate as soon as the fast-path code is JIT’ed, no matter if there are watchers or not. As another consequence, since the fast path works on a fixed property (e.g. sqrt) of a fixed Structure (e.g. S), but not on fixed objects, our watchpoints have to be in the form of <Structure, property>: they work on Structure-level but not object-level (they are called ValueReplacementWatchpointSet in JSC). For example,when a fast-path writing the sqrt property of Structure S is built, we have to be conservative and permanently invalidate WatchpointSet <S, sqrt>, since we have no way to know if that fast-path is going to run on our Math object in the future.
The Design
This leads to the following design in JSC. A WatchpointSet has three possible states[1]:
DoesNotExist: The WatchpointSet object does not physically exist (and is implicitly Valid). This is needed because there is an infinite number of watchable conditions, and also that we want to save memory. In this state, there exists no fast-path that rely on or violate the watchpoint. Slowpath executions that violate the watchpoint are not recorded (but doing so wouldn’t break the scheme).
Valid[2]: The watchpoint is valid: no fast-path that may violate the watched condition has been built, and one may build fast-path relying on the watchpoint condition as long as it adds itself into the watcher list.
Invalidated: The watchpoint is permaently invalidated.
As one can see from the example in the previous section, the Watchpoint system needs to handle interactions with three components:
Slow-path (C++ code) that may violate the watched condition.
Fast-path (JIT’ed code) that may violate the watched condition.
Code (C++ or JIT’ed) that is optimized assuming the watched condition is true.
For (1), the slow-path must check in the code any watchable condition it violated, and if the corresponding WatchpointSet exists, fire all watchers. However, in such case, the slow-path have the choice between invalidate the WatchpointSet, or to keep it valid[3].
For (2), the fast-path code does not check the watchable condition it violates, but we must transit all WatchpointSets it may violate when executed to Invalidated when such a fast-path is JIT’ed (and we must create such WatchpointSet object if it does not exist yet).
For (3), we must disable the code when the watcher callback is invoked. If the code is C++ code, then disabling the codepath is as easy as flipping a flag. If the code is JIT’ed code, we must jettison the code[4].
Back to Our Example, and Adaptive Watchpoints
Unfortunately, in our example, it turns out that only watching on <Structure, Property> is not enough. While this handles writes to existing properties correctly, one may create new properties in the object, thus transitioning its Structure. Say, one did a Math.abc = 123;. Since it adds a property to Math, the object Math gets a different structure S2, but our watchpoint is watching on <S, sqrt>, and we are screwed. To fix this issue, we must get notified when our object changes structure as well. However, as before, since an object-property-write fast-path works on a fixed Structure but not a fixed object, we have to put our watchpoint at Structure level. That is, we will have a WachpointSet on each Structure S, asserting that it never makes further transitions to other Structures (this is called a StructureTransitionWatchpointSet in JSC).
The last interesting piece is what to do when a StructureTransitionWatchpointSet turns to Invalidated state. If the transition happened on another object with the same Structure S, even though our Math object is not modified, we have no choice but to invalidate our code, as the StructureTransitionWatchpointSet for S has been invalidated, so we have no way to get notified if our Math object gets transitioned in the future.
However, if the transition happened on object Math (i.e. Math itself gets a new Structure), then it’s possible to keep our optimized code valid: we just need to start watching <S2, sqrt> instead. So we will move our ValueReplacementWatchpoint to watch <S2, sqrt> and our StructureTransitionWatchpoint to watch S2, and keep our code valid[5]. In JSC, such watchpoints whose action on fire is to move themselves to new places have a terminology AdaptiveWatchpoints.
Ending Thoughts
This way, by watching that the Math property of the global object never changes value, and that the sqrt property of the Math object never changes value, the code Math.sqrt is reduced from two object property lookups with a ton of error checks to a constant (not even a branch!) in the JIT’ed code.
The watchpoint mechanism also helps other optimizations to generate better code. For example, the call opcode (which calls whatever is stored in Math.sqrt) has its own inline caching that records which functions it has called. For sane programs that does not mess up with the predefined objects, there will be only one callee recorded: the sqrt intrinsic function. Normally this would allow the compiler to emit a check (that the result of expression Math.sqrt equals the sqrt intrinsic function) and speculatively inline sqrt. However, since the watchpoint already tells us that Math.sqrtmust evaluates to the sqrt intrinsic function, the compiler can do better: it may omit the check and inline sqrt directly. Now, for sane programs, all the terrible stuffs listed at the beginning of this post are gone, so the JIT’ed code to evaluate the Math.sqrt part is as efficient as if it were directly written in C++!
Finally, a couple of side notes:
If we want to avoid the case that the transition of another object results in invalidation of our code, we can give our object its own unique Structure, though the downside is that we might blow up the inline cache if we do it for too many objects.
The slow-path does not fire the watchpoint if the watchpoint is in DoesNotExist or Clear state. This not only saves memory, but is also an advantage for the use case above: while it’s plausible to assume that sane programs will not change Math.sqrt frequently, it’s also plausible for them to change it at program start (e.g., to log a warning if the input to sqrt is negative). Since such code will execute in slow-path and before any fast-path relying on the WatchpointSet is built, they will not invalidate the WatchpointSet, as desired.
Acknowledgements
I thank Saam Barati from JSC team for teaching me all of these (and more) using his precious spare time, and for his valuable comments on this post. Of course, any mistakes in this post are mine.
Footnotes
Note that the DoesNotExist state is not listed in the enum, since in this state the object doesn’t exist at all. ↩︎
In fact, JSC further distinguishes Valid state into Clear and Watched, to determine the behavior when a slow-path violation happened (see Footnote 3). However, this is only a design detail, so we put it in footnote for ease of understanding. ↩︎
When the WatchpointSet is in Clear state, the slow-path will keep it in Clear state. However, if it is in Watched state, even if there are no watchers, it will be transitioned to Invalidated state. ↩︎
Things get trickier if the code is already running (e.g., the code being jettisoned is the current function being executed, a function in the call stack, or even a function inlined by the current function), in which case we must OSR Exit to the baseline tier, but we will ignore such complexities in this post. ↩︎
Of course, if the ValueReplacementWatchpointSet of <S2, sqrt> or the StructureTransitionWatchpointSet of S2 is already Invalidated, we will still have to invalidate our code. ↩︎
In the past years, I have undergone a few cycles of learning the x86-64 memory model, only to eventually forget it again. Today I was fortunate to see a great paper which explained this matter very clearly, so I’m taking a note here for future reference.
The model in the paper is particularly easy to understand because it is described by standard software lock primitives[1], as below:
There is one global lock G.
There is one background thread T.
Each CPU has a store buffer, which is a queue of items <address, value>. The store buffer is pushed by the owning CPU, and popped by the background thread T.
The background thread T does only one thing:
Lock global lock G.
Pop an item <addr, value> from the store buffer of a CPU, write the value to main memory: MainMemory[addr] = value.
Unlock global lock G.
The procedure for a CPU to execute an instruction is described below.
STORE instruction
Push item <addr, value> to its store buffer.
LOAD instruction
Lock global lock G.
If addr exists in its store buffer, return corresponding value[2]. Otherwise return MainMemory[addr].
Unlock global lock G.
MFENCE instruction
Wait until its store buffer is eventually emptied by background thread T.
ATOMIC instruction
Lock global lock G.
Run the atomic instruction, using subroutines described above for LOAD and STORE.
Empty its own store buffer: pop every item <addr, value> from the store buffer and write to main memory: MainMemory[addr] = value, until the store buffer is empty.
Unlock global lock G.
Note that the semantics of LOAD and STORE provide the expected consistency on single-threaded programs.
An Application
Let’s analyze why the familiar spinlock implementation below is correct under x86-64 memory model:
We will prove the correctness via a token-counting argument. Each <lock, 0> in a store buffer counts as one token, and if MainMemory[lock] == 0, it also counts as one token. By definition at any moment the number of tokens cannot go below 0.
By the abstract machine semantics above, it’s not hard to prove that:
The background thread T cannot increase the total number of tokens.
Each Unlock() call creates one token.
Each Lock() call cannot return until it successfully consumes at least one token (If the CAS succeeded by seeing a 0 in its store buffer, that token is lost after the CAS because CAS flushes store buffer and also changes the memory value to 1. If the CAS succeeded by seeing a 0 in the main memory, that token is also lost because the store buffer item of the new value 1 is flushed to memory, overwriting the 0 value).
Initially there is one token (by the Init() call). Since Unlock() may only be called after[3] (guaranteed by program order) Lock(), the total number of tokens cannot go above one at any moment. So after a Lock() returns, there must be zero tokens, so no other Lock() can return. The total number of tokens goes back to one only when the Unlock() in that program is called, and only after that other Lock() operation may return. So the Lock() -> Unlock() time intervals are pairwisely non-overlapping, providing the mutual exclusiveness as one would expect.
Footnotes
Therefore, while the description is logically equivalent to the guarantees provided by the hardware, this is not how the hardware physically implements the memory subsystem. The hardware implementation is way more efficient. ↩︎
Of course, if addr showed up multiple times in the store buffer, we should return the value of the latest version. ↩︎
Throughout this argument, the time relationship is about wall clock time (or, the relative position in the interleaved event sequence of all CPUs). ↩︎