Today I got into a question loosely related to my research. Many language VMs choose to implement their own call stack, instead of piggybacking on the native C stack. Probably one advantage of such non-native stacks is that it makes implementing coroutines and stack walking easier.
But this is not my question. Everyone knows in C function calls are implemented by the call instruction and the ret instruction. These machine instructions implicitly modifies the SP stack pointer register and then redirect the control flow. So if we were to use a non-native stack (that is not managed by the SP register), the straightforward way is to simulate the call and ret by jmps. However, a ret is actually an indirect jump, since it jumps to non-literal address (the return address).
It is well known that indirect jumps are slow, since the jump target is hard to speculate, and if a CPU fails to speculate, it fails to run fast. So my question is:
How much slower is an (inpredictable) indirect jump compared with a
ret?
Unsurprisingly, modern CPUs extensively optimize ret given its pervasive use, through a specialized branch predictor called a Return Address Stack (RAS). That post also measured various hardware-specific limits of the RAS, and demonstrated the extraordinary performance punishment if a user program made the RAS unhappy. However, it did not measure how an impredictable indirect jump compares with a ret.
So I decided to experiment with it myself. The idea came off my head is the recursive Fibonacci function. Since it has two recursive calls, a ret simulated by indirect jmp will have two possible targets. Importantly, the pattern of which target being taken is complex and it is unlikely that a CPU can predict it.
So I wrote a simple recursive function using the C native stack, and a hand-rolled function using a custom stack. For the hand-rolled function, a recurse is implemented by a goto, and a return is implemented by a computed goto, using the GCC computed goto extension feature, with the key logic shown below (full benchmark code).
1 | struct StackFrame |
One tricky part is that GCC is smart enough to unroll the Fibonacci function into a single recursive call performed in a loop. We do not want this to happen, since the point of this microbenchmark is to have two call sites. Fortunately, by compiling with -O1, GCC won’t perform this unwanted optimization. I also confirmed that the assembly code generated by GCC correctly replicates the computation logic I wanted to test, as seen below.
1 | 00: mov %rdi,0x18(%rax) # %rdi = 0x30 |
I ran my microbenchmark code to compute fib(40)=102334155, and the result is as follow:
NOTE! THIS IS NOT VALID RESULT! Keep reading.
Custom stack (computed goto) took 0.301 seconds.
Native stack took 0.266 seconds.
So it seems like the non-native stack incurs about 10% overhead for Fibonacci: I know this is not a very accurate measurement, but I (naively) felt that it is good enough. So I decided to clean up my code a little bit for future record. Of course, the story is not that simple…
So, I decided to add a printf in the main function to make the output more informational. Of course, the printf is outside the benchmark timing region. Specifically, all I did is adding the two printf lines, exactly as shown below:
1 | int main() { |
I compiled and ran the code again, not expecting any changes in numbers. What astonished me is that my computed goto implementation went from 0.30s straight up to 0.34s!
Something clearly went wrong. But what could go wrong by adding two lines of printf? And the printf is not even in the code being timed!
I first tried to increase the input from 40 to 45 so the benchmark computation runs longer. It turns out that, without the additional printf, the computed goto implementation took 3.4s. But with the printf, the time increased to 3.9s. So the slowdown is not even a fixed slowdown, but scales with input! WHAT?!
Okay. So what if I delete one printf? I tried to delete the first printf, so the benchmark in question is executed first, and then the extra printf is executed. However, the 3.4s vs 3.9s slowdown is still there. How come this extra printf can slow down something that is executed before it?!
I decided to dump out the full assembly and compare line to line.
Surprisingly, and not surprisingly, the two versions are identical – except a few more lines of assembly at the expected spot that calls the extra printf. I am completely baffled.
Fortunately, even though I’m not sure if deities exist, I am skeptical that there is a deity who is responsible for my CPU’s performance. I soon realized that the code layout must have been changed by the extra printf. So I printed the pointer address of my function FibCustomStack. Indeed, the pointer changed from 0x****190 to 0x****1a0 (the higher digits are inheriently random due to ASLR).
Though I’m not a hardware feature expert, I still know that the CPU branch predictor works by hashing some bits in the address. The change in function address clearly also changes the address of all branch targets. Is this what caused the slowdown?
Fortunately this hypothesis is easy to validate. The FibCustomStack function can be easily modified to not reference any global variables/functions, and thus made trivially relocatable. Then, we can relocate this function to different addresses, and check for any change in performance.
I wrote a simple program to test this hypothesis (Note: the program is architecture-specific. My CPU is Intel Core i7-7700HQ CPU @ 2.80GHz. The program may or may not run on another CPU). It mmaps a memory region as executable, and copies the binary code for the FibCustomStack function to different offsets in the region, and tests its performance. The program currently only test different offsets of the lowest 7 bits (128 combinations), but changing this behavior is easy.
To plot the result, the execution time corresponding to the 128 offsets (raw data) are plotted into a 8x16 matrix, with the 16 columns denote the value of the lower 4 bits of the offset, and the 8 rows denote the higher 3 bits. The matrix is then plotted as a heat map: a darker color means a slower execution time. The fastest of all 128 values is 3.33s while the slowest is 4.54s: almost 50% slower than the fastest.
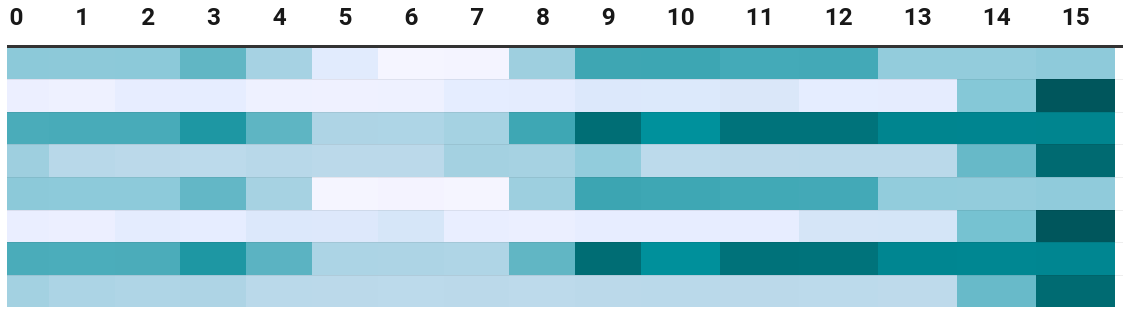
Somehow counter-intuitively, the function address that yields the fastest execution is not a multiple of 8 or 16. As a note, the function itself is compiled with -falign-functions=16 -falign-labels=16, so the offset between all branch targets and the function address is a multiple of 16. GCC treats it as an optimization to align functions and labels to power-of-2 byte boundaries, but this has been proven by the above heatmap to be not always beneficial. Therefore, the actual search space of code layouts is even larger: not only the higher bits of the function address (that is not tested by our simple program) may matter as well, but also internally, the function may arrange its branch targets at different (and not necessarily multiple-of-8 or 16) addresses to make the branch predictor’s hash function happy.
Another counter-intuitive observation from the raw data is, certain function addresses (especially the slow ones) make the execution time much less stable than others, as shown in the stddev tab. I can think of no explanation why such macro-scale fluctuations can happen.
I’m sure someone who knows more about hardware details than I do can explain better. If you have more ideas on what’s happening here, I’d really appreciate if you could send me an email (haoranxu510 [at] gmail.com)!
Conclusion
Although the experiment is still far from complete, the data collected as of now is already sufficient to disqualify the usefulness of the initial microbenchmark. While seemingly completely valid, it turns out that all we are testing is the performance at a random point inside a huge state space that is coincidentally thrown to us by the compiler.
It’s worth mentioning that the problem is not fixed even if the said microbenchmark were implemented in assembly: even in assembly, you cannot easily specify the address of your function. And due to ASLR, the higher address bits of your function is always unknown. And if the CPU branch predictor hashes physical address instead of virtual address (I don’t know if it’s true or not), then you cannot control your function address even with ASLR disabled.
Therefore, this demonstrates a case where even the expressiveness of C or assembly is not low-level enough to get sensible microbenchmark results. Furthermore, it is extremely easy to get misleaded: how counter-intuitive it is that the function address of your function can cause a up-to-50% performance impact!
So, I witnessed again the complexity of modern CPUs, and the difficulty of the attempts to “capture” its behavior through microbenchmarks.
P.S. During the experiment, I also hit a GCC miscompilation bug (repro) caused by its computed-goto extension. The comment in my repro explains what happened. I’m not fully certain if my code is completely UB-free (I’m not language standard expert), but I guess I will still limit my trust in the GCC computed goto extension as a result.